Dishonesty Exposed - Happy Climategate Day - Climategate 5 years old today!

Billy_Bob

Diamond Member
Sep 4, 2014
30,837
20,606
1,945
Top Of The Great Divide
Happy Climategate day!

Yes five years ago today the lies and data corruptions of the CRU and so called climate scientists in general were exposed. WE found out that they were manufacturing data, manipulating the whole climate record and throwing out the empirical evidence.

The ten most descriptive and unprofessional conduct quotes from the emails;

  • "OH FUCK THIS. It's Sunday evening, I've worked all weekend, and just when I thought it was done I'm hitting yet another problem that's based on the hopeless state of our databases. There is no uniform data integrity, it's just a catalogue of issues that continues to grow as they're found."

  • "So, once again I don't understand statistics. Quel surprise, given that I haven't had any training in stats in my entire life, unless you count A-level maths."

  • “I am seriously close to giving up, again. The history of this is so complex that I can't get far enough into it before by head hurts and I have to stop. Each parameter has a tortuous history of manual and semi-automated interventions that I simply cannot just go back to early versions and run the update prog. I could be throwing away all kinds of corrections - to lat/lons, to WMOs (yes!), and more.”

  • "Bear in mind that there is no working synthetic method for cloud, because Mark New lost the coefficients file and never found it again (despite searching on tape archives at UEA) and never recreated it."

  • "So.. should I really go to town (again) and allow the Master database to be ‘fixed’ by this program? Quite honestly I don't have time - but it just shows the state our data holdings have drifted into. Who added those two series together? When? Why? Untraceable, except anecdotally. It's the same story for many other Russian stations, unfortunately - meaning that (probably) there was a full Russian update that did no data integrity checking at all. I just hope it's restricted to Russia!!"

  • "Had a hunt and found an identically-named temperature database file which did include normals lines at the start of every station. How handy – naming two different files with exactly the same name and relying on their location to differentiate! Aaarrgghh!!"

  • "Here, the expected 1990-2003 period is MISSING - so the correlations aren't so hot! Yet the WMO codes and station names /locations are identical (or close). What the hell is supposed to happen here? Oh yeah - there is no 'supposed', I can make it up. So I have :)"

  • "Now looking at the dates.. something bad has happened, hasn't it. COBAR AIRPORT AWS cannot star[t] in 1962, it didn't open until 1993!"

  • "So with a somewhat cynical shrug, I added the nuclear option - to match every WMO possible, and turn the rest into new stations (er, CLIMAT excepted). In other words, what CRU usually do. It will allow bad databases to pass unnoticed, and good databases to become bad, but I really don't think people care enough to fix 'em, and it's the main reason the project is nearly a year late."

  • "Because although I'm thrilled at the high match rate (87%!), it does seem worse when you realize that you lost the rest.."

When you look back at this mess and where we are today it amazes me that this lie still has legs.

Happy Climategate Day!

Source 1
Source 2
 
Evidence that Dr Michael Mann misled a court

The hits just keep on coming... And the evidence goes right on back to the climategate emails where the lies of Dr Mann, Kieth Briffa, and the staff of the CRU and East Anglia were fully exposed..

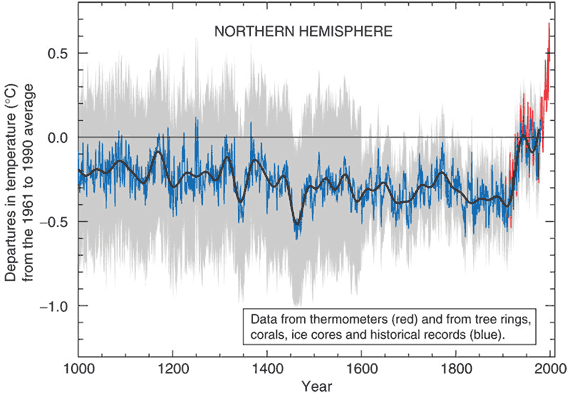
First, it will be demonstrated that Dr Michael Mann, the plaintiff and appellee in the case, materially misled the court in his Brief of Appellee filed 3 September 2014 by falsely stating (1)that the finding of Sir Muir Russell in an inquiry into revelations of malpractice by climate scientists in the “Climategate emails” that a depiction of three graphs of northern-hemisphere temperature changes from 1000-2000 AD, reconstructed from tree-rings and published on the front cover of the World Meteorological Organization’s Statement on the Status of the Global Climate in 1999 on the WMO’s 50th anniversary in 2000, was misleading “had absolutely nothing to do with Dr Mann or with any graph prepared by him”; and (2) that “Dr Mann did not create this depiction”.

Lots of information about how they mislead everyone and how the lie is perpetuated.. Its a good read. Happy Climategate Day!

Source
 
5 years ago, deniers were caught lying on such an epic scale, everyone outside of that liars' cult now correctly assumes everything they say is a lie.

We know Billy is proud member of that liars' cult.

For example, he claims to be studying for doctorate in atmospheric science, but won't tell us where. Like his cult masters, he's a proud liar. Templar, I wouldn't get too close to that one.
So where's that email?
 
5 years ago, deniers were caught lying on such an epic scale, everyone outside of that liars' cult now correctly assumes everything they say is a lie.

We know Billy is proud member of that liars' cult.

For example, he claims to be studying for doctorate in atmospheric science, but won't tell us where. Like his cult masters, he's a proud liar. Templar, I wouldn't get too close to that one.

The Decline Hiders are more dangerous than wounded animals. They've been outed as liars and fake so they double down on their viciousness and attacks
Lost their dentures and their bite turned into gum disease!
 
5 years ago, deniers were caught lying on such an epic scale, everyone outside of that liars' cult now correctly assumes everything they say is a lie.

We know Billy is proud member of that liars' cult.

For example, he claims to be studying for doctorate in atmospheric science, but won't tell us where. Like his cult masters, he's a proud liar. Templar, I wouldn't get too close to that one.

The LIAR's Club President speaks.. and all we hear is garbled crap and the Alinsky tactics failing..
 
5 years ago, deniers were caught lying on such an epic scale, everyone outside of that liars' cult now correctly assumes everything they say is a lie.

We know Billy is proud member of that liars' cult.

For example, he claims to be studying for doctorate in atmospheric science, but won't tell us where. Like his cult masters, he's a proud liar. Templar, I wouldn't get too close to that one.

The Decline Hiders are more dangerous than wounded animals. They've been outed as liars and fake so they double down on their viciousness and attacks
Lost their dentures and their bite turned into gum disease!

We should call it gummer..... pile......
 
http://www.skepticalscience.com/Mikes-Nature-trick-hide-the-decline-advanced.htm

Clearing up misconceptions regarding 'hide the decline'


What the science says...
Select a level... Basic Intermediate
level3.gif
Advanced
There are a number of misconceptions regarding 'hide the decline':

  1. The "decline" does not refer to a "decline in global temperature" as often claimed. It actually refers to a decline in tree growth at certain high-latitude locations. This decline began in the 1960s when tree-ring proxies diverged from the temperature record.
  2. "Mike's Nature trick" has nothing to do with "hide the decline". "Mike's trick" refers to a technique by Michael Mann to plot instrumental temperature data on the same graph as reconstructed data over the past millennium.
  3. The divergence of tree-ring proxies from temperatures after 1960 is openly discussed in the peer-reviewed literature and the last two IPCC assessment reports.
Climate Myth...
Scientists tried to 'hide the decline' in global temperature
'Perhaps the most infamous example of this comes from the "hide the decline" email. This email initially garnered widespread media attention, as well as significant disagreement over its implications. In our view, the email, as well as the contextual history behind it, appears to show several scientists eager to present a particular viewpoint-that anthropogenic emissions are largely responsible for global warming-even when the data showed something different.' (David Lungren)


"Hide the decline" has become a slogan for climate skeptics. However, there are several misconceptions concerning this email that give a misleading picture of the science discussed in Phil Jones' email. When one takes the time to read the email and understand the science discussed, the misconceptions are easily put into proper context.

The decline is about northern tree-rings, not global temperature
Phil Jones' email is often cited as evidence of an attempt to "hide the decline in global temperatures". This claim is patently false and demonstrates ignorance of the science discussed. The decline actually refers to a decline in tree growth at certain high-latitude locations since 1960.

Tree-ring growth has been found to match well with temperature and hence tree-rings are used to plot temperature going back hundreds of years. However, tree-rings in some high-latitude locations diverge from modern instrumental temperature records after 1960. This is known as the "divergence problem". Consequently, tree-ring data in these high-latitude locations are not considered reliable after 1960 and should not be used to represent temperature in recent decades.

The divergence problem has been openly discussed in the peer-reviewed literature since 1995 when it was noticed that Alaskan trees were showing a weakened temperature signal in recent decades (Jacoby 1995). This work was broadened in 1998 using a network of over 300 tree-ring records across high northern latitudes (Briffa 1998). From 1880 to 1960, tree growth closely matches temperature measurements. However, the correlation drops sharply after 1960 for certain trees at high latitudes.

Divergence_Tree_Growth_Temp.gif

Figure 1: Twenty-year smoothed plots of tree-ring width (dashed line) and tree-ring density (thick solid line), averaged across a network of mid-northern latitude boreal forest sites and compared with equivalent-area averages of mean April to September temperature anomalies (thin solid line). (Briffa 1998)

Does the divergence problem mean we cannot rely on tree-ring growth as a proxy for temperature in the past? Briffa 1998 shows that tree-ring width and density show close agreement with temperature back to 1880. To examine earlier periods, one study split a network of tree sites into northern and southern groups (Cook 2004). While the northern group showed significant divergence after the 1960s, the southern group was consistent with recent warming trends.

This is a general trend with the divergence problem - trees from high northern latitudes show divergence while low latitude trees show little to no divergence. Before the 1960s, the northern and southern trees tracked each other reasonably well back to the Medieval Warm Period. This suggests the current divergence problem is unique over the past thousand years and is restricted to recent decades.

A thorough review of the many peer reviewed studies investigating possible contributing factors can be found in On the ’divergence problem’ in northern forests: A review of the tree-ring evidence and possible causes (D’Arrigo 2008). Some of the findings:

  • Various studies have noted the drop in Alaskan tree-growth coincides with warming-induced drought. By combining temperature and rainfall records, growth declines were found to be more common in the warmer, drier locations.
  • Studies in Japan and Bavaria suggest increasing sulfur dioxide emissions were responsible.
  • As the divergence is widespread across high northern latitudes, Briffa 1998 suggests there may be a large scale explanation, possibly related to air pollution effects. A later study by Briffa proposed that falling stratospheric ozone concentration is a possible cause of the divergence, since this observed ozone decline has been linked to an increased incidence of ultraviolet (UV-B) radiation at the ground (Briffa 2004).
  • Connected to this is global dimming (a drop in solar radiation reaching the ground). The average amount of sunlight reaching the ground has declined by around 4 to 6% from 1961 to 1990.
  • One study suggests that microsite factors are an influence on whether individual trees are vulnerable to drought stress. Eg - the slope where the tree is located, the depth topermafrost and other localised factors (Wilmking 2008). This paper amusingly refers to the divergence problem as the "divergence effect" so as "to not convey any judgement by the wording" (you wouldn't want to offend those overly sensitive Alaskan trees).
There is evidence for both local and regional causes (e.g. drought stress) as well as global scale causes (e.g. global dimming). It's unlikely there's a single smoking gun to explain the divergence problem. More likely, it's a complex combination of various contributing factors, often unique to different regions and even individual trees.

It's worth noting that reconstructions of past temperature are based on a range of proxydata. Reconstructions of temperature made with and without the use of tree-ring data obtain essentially the same result, finding that recent warmth is unprecedented over the last 1300 years (Mann et al 2008).

The "decline" has nothing to do with "Mike's trick".
Phil Jones talks about "Mike's Nature trick" and "hide the decline" as two separate techniques. However, people often abbreviate the email, distilling it down to "Mike's trick to hide the decline". Professor Richard Muller from Berkeley commits this error in a public lecture:

"A quote came out of the emails, these leaked emails, that said "let's use Mike's trick to hide the decline". That's the words, "let's use Mike's trick to hide the decline". Mike is Michael Mann, said "hey, trick just means mathematical trick. That's all." My response is I'm not worried about the word trick. I'm worried about the decline."

Muller quotes "Mike's nature trick to hide the decline" as if its Phil Jones's actual words. However, the original text indicates otherwise:

"I’ve just completed Mike’s Nature trick of adding in the real temps to each series for the last 20 years (ie from 1981 onwards) and from 1961 for Keith’s to hide the decline."

It's clear that "Mike's Nature trick" is quite separate to Keith Briffa's "hide the decline". Somehow Jones' original email has morphed into "Mike's nature trick to hide the decline" to the point where even Professor Muller quotes this line as fact.

So what is "Mike's Nature trick"? This refers to a technique (in other words, "trick of the trade") used in a paper published in Nature by lead author Michael Mann (Mann et al 1998). The "trick" is the technique of plotting recent instrumental data along with the reconstructed data. This places recent global warming trends in the context of temperature changes over longer time scales. Here is the original hockey stick graph published in Mann et al 1998:

hockey_stick1998.gif

Figure 2: Northern Hemisphere mean temperature anomaly in °C (Mann et al 1998).

The temperature reconstruction was extended back to 1000 AD and published in Mann et al 1999 which was reproduced in the IPCC Third Assessment Report, shown below:

hockey_stick.gif


Figure 3: Northern Hemisphere mean temperature anomaly in °C (Mann et al 1999).

There is nothing secret about "Mike's trick". Both the instrumental and reconstructed temperature are clearly labelled in Mann's 1998 Nature article, the follow-up Mann et al 1999 and the IPCC Third Assessment Report. To claim this is some sort of secret, nefarious "trick", or worse - to confuse this with "hide the decline" - displays either ignorance or a willingness to mislead.

The "decline" has been openly and publicly discussed since 1995
While skeptics like to portray "the decline" as a phenomena that climate scientists' have tried to keep secret, the divergence problem has been publicly discussed in the peer-reviewed literature since 1995 (Jacoby 1995).

In Phil Jones' email, he was discussing a graph for the cover of an obscure 1999 World Meteorological Organisation (WMO) report, which depicted both instrumental temperature data and reconstructed temperatures based on tree rings. The Independent Climate Change Email Review examined the email and the WMO report and made the following criticism of the resulting graph (its emphasis):

[T]he figure supplied for the WMO Report was misleading. We do not find that it is misleading to curtail reconstructions at some point per se, or to splice data, but we believe that both of these procedures should have been made plain — ideally in the figure but certainly clearly described in either the caption or the text. [1.3.2]

But this was one isolated instance that occurred more than a decade ago. The Review did not find anything wrong with the overall picture painted about divergence (or uncertainties generally) in the literature and in IPCC reports. The Review notes that the WMO report in question “does not have the status or importance of the IPCC reports”, and concludesthat divergence “is not hidden” and “the subject is openly and extensively discussed in the literature, including CRU papers.” [1.3.2]

How do the IPCC portray the temperature reconstructions of Mann and Briffa? In the 2001 Third Assessment Report (TAR), the Chapter 2 of Working Group 1 (WG1) presentedreconstructions from Mann et al. (1999), Jones et al. (1998), and Briffa (2000) in Figure 2.21:

TAR_Fig2-21.png


Briffa (2000) included data up to the year 2000, whereas the study's tree ring data presented in this figure is truncated at the year 1960. Section 2.3.2.1 of the IPCC TARWG1 (Paleoclimate proxy indicators) has a sub-section devoted to a detailed discussion of tree ring data, including the following text (Page 131), emphasis added:

There is evidence, for example, that high latitude tree-ring density variations have changed in their response to temperature in recent decades, associated with possible nonclimatic factors (Briffa et al., 1998a). By contrast, Vaganov et al. (1999) have presented evidence that such changes may actually be climatic and result from the effects of increasing winter precipitation on the starting date of the growing season (see Section 2.7.2.2). Carbon dioxide fertilization may also have an influence, particularly on high-elevation drought-sensitive tree species, although attempts have been made to correct for this effect where appropriate (Mann et al., 1999). Thus climate reconstructions based entirely on tree-ring data are susceptible to several sources of contamination or non-stationarity of response. For these reasons, investigators have increasingly found tree-ring data most useful when supplemented by other types of proxy information in “multi-proxy” estimates of past temperature change (Overpeck et al., 1997; Jones et al., 1998; Mann et al., 1998; 1999; 2000a; 2000b; Crowley and Lowery, 2000).”
This seems like a very clear and explicit discussion of the shortcomings of high latitude tree rings as an accurate temperature proxy over the past several decades, some possible reasons for the divergence, and how the divergence problem should be treated (by supplementing it with other proxies).

As with the TAR, the tree ring proxy data and divergence problem discussion in the IPCC 4th Assessment Report (AR4) is quite detailed and explicit. Below is the relevant discussion from AR4 WG1 Section 6.6.1.1 (Page 472-473), emphasis added:

“Several analyses of ring width and ring density chronologies, with otherwise well-established sensitivity to temperature, have shown that they do not emulate the general warming trend evident in instrumental temperature records over recent decades, although they do track the warming that occurred during the early part of the 20th century and they continue to maintain a good correlation with observed temperatures over the full instrumental period at the interannual time scale (Briffa et al., 2004; D’Arrigo, 2006). This ‘divergence’ is apparently restricted to some northern, high latitude regions, but it is certainly not ubiquitous even there. In their large-scale reconstructions based on tree ring density data, Briffa et al. (2001) specifically excluded the post-1960 data in their calibration against instrumental records, to avoid biasing the estimation of the earlier reconstructions (hence they are not shown in Figure 6.10), implicitly assuming that the ‘divergence’ was a uniquely recent phenomenon, as has also been argued by Cook et al. (2004a). Others, however, argue for a breakdown in the assumed linear tree growth response to continued warming, invoking a possible threshold exceedance beyond which moisture stress now limits further growth (D’Arrigo et al., 2004). If true, this would imply a similar limit on the potential to reconstruct possible warm periods in earlier times at such sites. At this time there is no consensus on these issues (for further references see NRC, 2006) and the possibility of investigating them further is restricted by the lack of recent tree ring data at most of the sites from which tree ring data discussed in this chapter were acquired.”
Again, there is explicit discussion of the divergence problem (even moreso than in theTAR), of its possible causes, and how it should be dealt with scientifically. In this case, the text specifically states that the post-1960 data is excluded from the Briffa et al. (2001) data plotted in Figure 6.10:

AR4_Fig6-10.png


The common misconception that scientists tried to hide a decline in global temperatures is false. The decline in tree-ring growth is plainly discussed in the publicly available scientific literature. The divergence in tree-ring growth does not change the fact that we are currently observing many lines of evidence for global warming. The obsessive focus on a short quote, often misquoted and taken out of context, doesn't change the scientific case that human-caused climate change is real.


'hide the decline' has always been about hiding the poor performance of proxy data to represent temperatures. the Briffa series was truncated at both ends and only the 60% in the middle was used. all three original series had instrumental data grafted onto the end and padded with instrumental data for (x) years before the nominal end date so that the it could be smoothed and join up with instrumental temperature records without a discontinuity. no description of these 'improvements' was given on the graph or in the caption.


Were still playing HIDE THE DECLINE today. USCRN is showing a major drop in Northern Hemisphere temps but the Old network is being Homogenized and adjusted to keep the lie alive.. And the GISS adjustments affect the whole globe temps.. They are still playing hide the decline...
 
You haven't addressed a SINGLE point brought out in the article. The decline was not in temperatures, it was in the ratio between temperatures and North American tree ring widths.

The adjustments being made by NCDC, NOAA, GISS and others (worldwide) to historical temperature data are fully justified. If getting closer to the truth takes us further from your fantasy, grow a pair.
 
There is a huge amount of money invested in lying about what the scientists are finding concerning the effects of the GHGs that we have put into the atmosphere. And, because most 'Conservatives' fear any kind of change, they buy into the lies whole heartedly. Even when their own eyes are telling them that what they are repeating is lies.

But change there is going to be. The fact that we are increasing the atmospheric load of GHGs gaunantees that. And it will be a much more negative change for all of us than a major reduction in the use of fossil fuels would be.
and yet no experiment to prove a point/ position. So still no evidence to support anything to which you write. sigh...........................................
 
You haven't addressed a SINGLE point brought out in the article. The decline was not in temperatures, it was in the ratio between temperatures and North American tree ring widths.

The adjustments being made by NCDC, NOAA, GISS and others (worldwide) to historical temperature data are fully justified. If getting closer to the truth takes us further from your fantasy, grow a pair.
and again the temperature adjustments are needed why?
 
You haven't addressed a SINGLE point brought out in the article. The decline was not in temperatures, it was in the ratio between temperatures and North American tree ring widths.

The adjustments being made by NCDC, NOAA, GISS and others (worldwide) to historical temperature data are fully justified. If getting closer to the truth takes us further from your fantasy, grow a pair.

Two Words..

BULL SHIT!

Now that we have determined that the adjustments and homogenization have no basis in reality and are based on MODELS, which have all failed, WHY DON'T YOU produce the Data, Methods, and procedures which show just exactly what mans contribution has done to earths temperature.. Leave your broken models at home and lets talk empirical evidence...
 
5 years ago, deniers were caught lying on such an epic scale, everyone outside of that liars' cult now correctly assumes everything they say is a lie.

We know Billy is proud member of that liars' cult.

For example, he claims to be studying for doctorate in atmospheric science, but won't tell us where. Like his cult masters, he's a proud liar. Templar, I wouldn't get too close to that one.


lol......there ya go.......the typical mental rant from an AGW bozo who's been publically pwned......2-3 sentences long as always!!!


Every time Mamooth steps into the forum its like a centipede ambulating in with 98 missing legs
 
Last edited:
At the time Climategate hit......31 billion dollars were being traded on the European carbon market. This was not only fraud.....this was criminal and the British government took it as such.

Subsequently, as we all know, the investigation was conducted by science industry peers...............like Obama calling on an investigation of himself conducted by Obama!!!:2up::eusa_dance::eusa_dance:

Anybody with half a brain knows what happened here..........but if you don't, here ya go >>>

Articles Climategate Is It Criminal


Don't forget.........millions would be lost to almost every major university of the global warming hoax was exposed. Offcukingcourse they are going to rig the investigation.:banana:


Mashishiro sums it up in a nutshell................


Last edited:

Forum List

Back
Top