
- May 20, 2009
- 144,494
- 66,888
- 2,330
The unaltered data is the data. Do you not understand that?
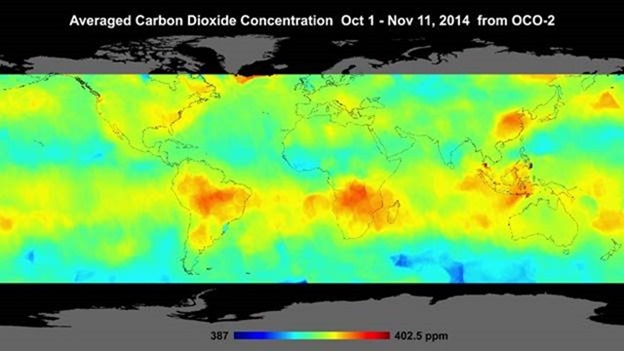
^ Unaltered satellite data over a 5 week period showing the equatorial rain forest are the biggest producers of CO2, thereby effectively failing the AGWCult theory.
Why do you still believe mankind produces most of the CO2?
I'm not disagreeing with the data. I am saying that the same source that you pulled this data from overwhelming says that AGW is real and a threat to our planet. Overwhelmingly.
Weird how you cherry pick one chart and yet somehow ignore everything else being said by the source you used. Why is that?
Clearly, the people SAYING that are either lying or idiots. No third option.
Look at the data from a 5 week period. Where's the AGW?
So unlike you I took the time to actually understand your image and what the data means. I found the article where it came from.
News | NASA's Spaceborne Carbon Counter Maps New Details
""Preliminary analysis shows these signals are largely driven by the seasonal burning of savannas and forests,"".
"The time period covered by the new maps is spring in the Southern Hemisphere, when agricultural fires and land clearing are widespread."
Looks like those spikes are in fact due to human activity. Want to cherry pick any other data that ultimately doesn't tell the narrow-minded story you want to tell.
Now, lets get back to NASA and the fact that they say that AGW is very much real, just like your chart proves.
Thanks turnip!
LOL!
I almost feel sorry for you.
Almost
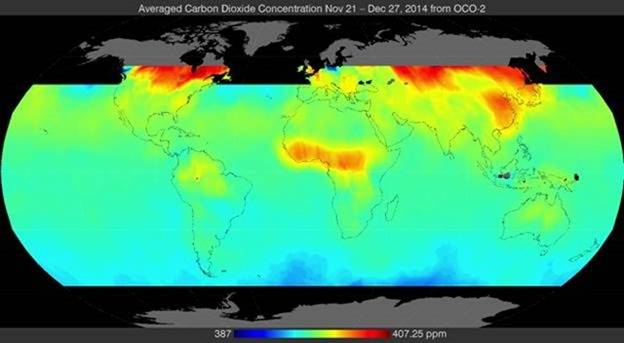
here's the next, and last, 6 weeks NASA every published from OCO2, they went dark after this.
I wonder why?
You will believe ANYTHING they tell you!
ANYTHING!
So let me get this straight. You say the data is correct, but their analysis of the data is wrong? But your analysis, with your background in _________ is more accurate than theirs.
Do I understand this correctly?
Clearly you don't understand much of anything, you just parrot back whatever you're told.
If the CO2 is truly from biomass burning, then should the AGWcult be going after rural farmers in South America, Africa and Australia.
Why aren't you?