Antarctic sea ice headed for new record minimum

joshuah

Member
Feb 1, 2014
47
6
6
Southern Hemisphere sea ice hits its annual minimum in late February every year. This year measurements are the highest ever recorded for this time of year, and if it holds we will have a new record high minimum.

See Cryosophere Today charts here.
 
While sea ice has increased in the western Ross Sea and the Weddell Sea, it has declined in the Amundsen and Bellingshausen seas.

https://nsidc.org/arcticseaicenews/

Republicans think when you say "Global Warming" that means temperatures will go up evenly all over the world. Once, a right wingers on the USMB told me "evaporation" was a "wild liberal theory". Perhaps they meant evolution, but we were talking about weather, so "who knows"?

Global Warming, it's not global and it's not warming. You must have Faith for it to work
 
While sea ice has increased in the western Ross Sea and the Weddell Sea, it has declined in the Amundsen and Bellingshausen seas.

https://nsidc.org/arcticseaicenews/

Republicans think when you say "Global Warming" that means temperatures will go up evenly all over the world. Once, a right wingers on the USMB told me "evaporation" was a "wild liberal theory". Perhaps they meant evolution, but we were talking about weather, so "who knows"?

[ame=http://www.youtube.com/watch?v=Zi8Otb_AXho]Blah Blah Blah - Ke ft. 3OH!3 (Lyrics) - YouTube[/ame]
 
http://nsstc.uah.edu/climate/2013/december/dec2013GTR.pdf

2013 was the fourth warmest year in the satellite era, trailing only 1998, 2010 and 2005, according to Dr. John Christy, a professor of atmospheric science and director of the Earth System Science Center at the University of Alabama in Huntsville. The warmest areas during the year were over the North Pacific and the Antarctic, where temperatures for the year averaged more than 1.4 C (more than 2.5 degrees Fahenheit) warmer than normal. There were small areas of cooler than normal temperatures scattered about the globe, including one area over central Canada where temperatures were 0.6 C (about 1.1 degrees Fahrenheit) cooler than the 30-year norm.

I thought the Pacific Ocean ate all the warming? Can you pick a story and stick with it?

images


Put up your money and keep your eye on the manmade Global Warming
 
Last edited:
http://nsstc.uah.edu/climate/2013/december/dec2013GTR.pdf

2013 was the fourth warmest year in the satellite era, trailing only 1998, 2010 and 2005, according to Dr. John Christy, a professor of atmospheric science and director of the Earth System Science Center at the University of Alabama in Huntsville. The warmest areas during the year were over the North Pacific and the Antarctic, where temperatures for the year averaged more than 1.4 C (more than 2.5 degrees Fahenheit) warmer than normal. There were small areas of cooler than normal temperatures scattered about the globe, including one area over central Canada where temperatures were 0.6 C (about 1.1 degrees Fahrenheit) cooler than the 30-year norm.

That's NOT what the official satellite record says. UAH Lower Tropo monthly for the Southern OCEAN was .23, .22, .24, .19, .19 for the last months of 2013..


http://www.nsstc.uah.edu/data/msu/t2lt/uahncdc_lt_5.6.txt

So if UAH is pulling out higher numbers, it must be from LOCAL hotspots, not a general trend or even an average of the waters around the continent.. Your quote VERIFIES this when it talks about "there were SMALL AREAS of cooler than normal temps.... " ANYONE can find excuses.. A theory and a prediction are much more difficult..

I doubt whether there has been ANY general trend in warming the lower troposphere in the proximity of Antarctica.. It's NOT in the sat data.
 
BTW OldiRocks -- I checked the adjacent column for LAND and there IS an anomaly for the end of 2013.
And it's kinda strong. But the theory of BUILDING sea ice was based on warmer WATERS not warmer land mass. And it depends on those "warmer waters" building sea ice thru INCREASED PRECIPT.

WHERE'S the increased precipitiation that your prediction makes??
 
The increased precipitation didn't materialize. That paper you fellows brought up (through Hockey Schtick, I think) had an explanation for that regarding how clouds form and dissipate. It was the one that thought climate sensitivity should be closer to 4.5C than to 3. Anyway, the increased water temperatures have as have the increased glacial flow rates, particularly where ice shelves have collapsed. The rate at which Antarctic and Greenland are putting water into the oceans - raising sea levels - has increased. Do YOU have an explanation for that?
 
Last edited:
The increased precipitation didn't materialize. That paper you fellows brought up (through Hockey Schtick, I think) had an explanation for that regarding how clouds form and dissipate. It was the one that thought climate sensitivity should be closer to 4.5C than to 3. Anyway, the increased water temperatures have as have the increased glacial flow rates, particularly where ice shelves have collapsed. The rate at which Antarctic and Greenland are putting water into the oceans - raising sea levels - has increased. Do YOU have an explanation for that?

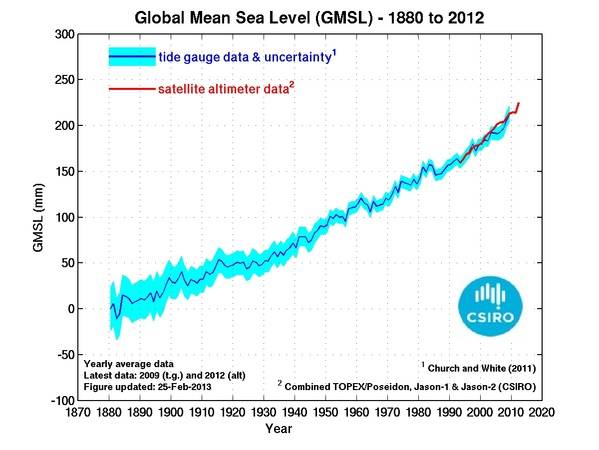
Then why is sea level rise slowing down - 2.2mm/yr the last 5 years down from 2.5mm/yr last 5 before that down from 3mm/yr last 5 before that?
 
The increased precipitation didn't materialize. That paper you fellows brought up (through Hockey Schtick, I think) had an explanation for that regarding how clouds form and dissipate. It was the one that thought climate sensitivity should be closer to 4.5C than to 3. Anyway, the increased water temperatures have as have the increased glacial flow rates, particularly where ice shelves have collapsed. The rate at which Antarctic and Greenland are putting water into the oceans - raising sea levels - has increased. Do YOU have an explanation for that?

Then why is sea level rise slowing down?

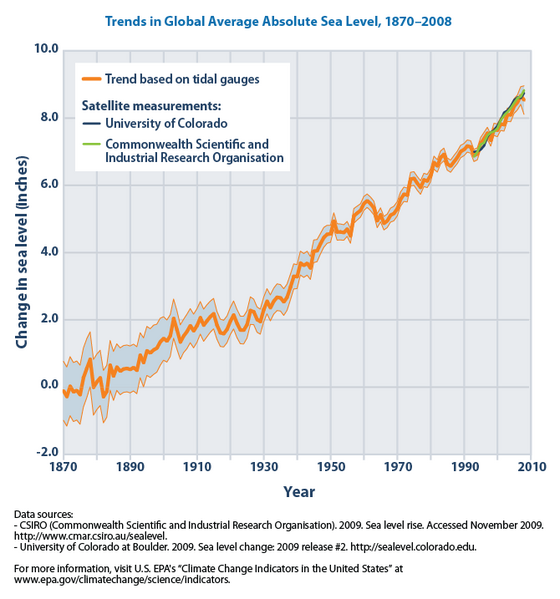
It's not. It's actually accelerating.

https://en.wikipedia.org/wiki/Sea_level_rise

Current sea level rise is about 3 mm/year worldwide. According to the US National Oceanic and Atmospheric Administration (NOAA), "this is a significantly larger rate than the sea-level rise averaged over the last several thousand years", and the rate may be increasing.[2] This rise in sea levels around the world potentially affects human populations in coastal and island regions[3] and natural environments like marine ecosystems.[4]
Between 1870 and 2004, global average sea levels rose 195 mm (7.7 in), 1.46 mm (0.057 in) per year.[5] From 1950 to 2009, measurements show an average annual rise in sea level of 1.7 ± 0.3 mm per year, with satellite data showing a rise of 3.3 ± 0.4 mm per year from 1993 to 2009,[6] a faster rate of increase than previously estimated.[7] It is unclear whether the increased rate reflects an increase in the underlying long-term trend.[8]

560px-Trends_in_global_average_absolute_sea_level%2C_1870-2008_%28US_EPA%29.png


References

1) US Environmental Protection Agency (US EPA) (2010). "Sea Level: Climate Change: US EPA". US EPA.
2) Is sea level rising?
3) Bindoff, N.L., J. Willebrand, V. Artale, A, Cazenave, J. Gregory, S. Gulev, K. Hanawa, C. Le Quéré, S. Levitus, Y. Nojiri, C.K. Shum, L.D. Talley and A. Unnikrishnan (2007) "Section 5.5.1: Introductory Remarks" in IPCC AR4 WG1 2007 Chapter 5: Observations: Ocean Climate Change and Sea Level ISBN 978-0-521-88009-1
4) Fischlin; et al., "Section 4.4.9: Oceans and shallow seas – Impacts", in IPCC AR4 WG2 2007, Chapter 4: Ecosystems, their Properties, Goods and Services, p. 234
5) Church, John; White, Neil (January 6, 2006). "A 20th century acceleration in global sea-level rise". Geophysical Research Letters 33: L01602. Bibcode:2006GeoRL..3301602C. doi:10.1029/2005GL024826. L01602. Retrieved 2010-05-17. pdf is here [1]
6) Nicholls, Robert J.; Cazenave, Anny (18 June 2010). "Sea-Level Sea-Level Rise and Its Impact on Coastal Zones". Science Magazine 328 (5985): 1517–1520. Bibcode:2010Sci...328.1517N. doi:10.1126/science.1185782.
7) IPCC, Synthesis Report, Section 1.1: Observations of climate change, in IPCC AR4 SYR 2007.
8) IPCC, Synthesis Report, Section 1.1: Observations of climate change, in IPCC AR4 SYR 2007; Dahlman, L. (2009). "NOAA Climate Portal: ClimateWatch Magazine: Climate Change: Global Sea Level". NOAA Climate Services. Retrieved 2011-07-29.
 
Last edited:
JOSHUAH

Just out of curiosity, what source tells you that it is slowing? You're certainly not the only one to have expressed that view.
 

Forum List

Back
Top