Answers wanted from "global warming" supporters

Problems in the collection of atmospheric CO2 data parallel other absurdities in the global warming fraud. The Climategate scandal is exposing the massive and systematic fraud behind the fabrication of the worldwide temperature record necessary to make the case for global warming. But what about the record of atmospheric CO2?

The U.S. NOAA openly admits to producing a CO2 record which "contains no actual data." NOAA temperature stations sited in ways that artificially inflate temperatures have been exposed over the past two years. CO2 observatories have similar flaws. Two of the five NOAA "baseline" stations are downwind from erupting volcanoes. All five are subject to localized or regional CO2 sources.

Full article here:

American Thinker: Greenhouse Gas Observatories Downwind from Erupting Volcanoes
 
A right wing nut blog?

You must be joking.

You really need to get out more.

Unless you are just working for the American Petroleum Institute.
 
The poor UK Guardian is none too happy about the growing - and justifiable, skepticism that now surrounds the flat-earth warmers' hopes for a Cap n Tax big money shakedown...

Low targets, goals dropped: Copenhagen ends in failureDeal thrashed out at talks condemned as climate change scepticism in action

...Lydia Baker of Save the Children said world leaders had "effectively signed a death warrant for many of the world's poorest children. Up to 250,000 children from poor communities could die before the next major meeting in Mexico at the end of next year."


Low targets, goals dropped: Copenhagen ends in failure | Environment | guardian.co.uk

____

Oh the flat earth warmer drama!!!!! :)
 
“But it disappointed African and other vulnerable countries who had been holding out for far deeper emission cuts to hold the global temperature rise to 1.5C this century.”

It always fascinates me to see that at least the writer believes and it is implied that many in Africa believes we can actually control the global temperatures. Has anyone really thought it through? Even if the AGW theory is correct(I don’t believe it to be) how does man go about preventing CO2 emissions without significant and radical changes not only to our economic world and lifestyles but even the ecological world we live in. How is CO2 emission reductions practically applied? Has anyone logically expressed how this is to occur without wiping out most of the human race?


Guardian Headline – Low targets, goals dropped: Copenhagen ends in failure « Watts Up With That?
 
We are pumping billions of tons of CO2 into the atmosphere every year. We are going to double CO2 levels, no question. ....
Seriously. Are you retarded? Back it up. That means don't just type it; provide supporting information for it.

Otherwise, you just typed bullshit.

.... And yes, we are warming the earth, but this warming is always within the context of the Sun's activity.

The guys at MIT estimate that this warming will be 4-7 degrees in the next century.
And, those guys at MIT have used a non-scientific model (if you're still talking about the same thing you keep trying to pitch). We've already been through this, Chris, yet you still post this bullshit. One must conclude that there are two highly probably reasons for that: You are stupid or you are dishonest. Perhaps it's both.

Yes, you know more than the people at MIT.


Which people at MIT are you citing?

They made one prediction 3 years ago and another this year. They do not agree. Neither one reproduces actual history. Care to be a little more specific? Also, care to explain why you prefer one MIT prediction over the other one?
 
We account for a small percentage of overall CO2.

The climate variables are such that this percentage could be even more minimal than many skeptics even believe.

The earth has been warmer than it is now.

The earth will warm and the earth will cool.


Scientists manipulated data, attempted to squash opposing views, and perhaps utilized selective temp. samples.


Global warming is proving itself the farce so many have felt it to be for some time now...

No one has disproven that CO2 causes the earth to retain heat or that CO2 levels have increased by 40% in the last 200 years.

Those are the only facts that count.

Nice try at a diversion. You guys are really good at that. It's all you have unfortunately for you.


The skeptics are saying that the warming may be natural and it may be suplemented by Man's activities, but the amount of the Anthopogenic impact is unknown. Skeptics say that warming has occurred in the past and has not been the result of any impact by Man's activities. Cooling has followed and, again, has occurred naturally.

Alarmists, such as youself, say that the activities of Man are the one variable that is changing everything and that variable can be addressed and the clamate can be changed in spite of absolutely no evidence to back up their claims.

It is not incumbant on the skeptics to prove something that isn't happening isn't happening.

It is incumbant on the Alarmists to prove that the one and only cause that they cite is in truth the one and only cause.

You are welcome to proceed.
____

Right on.
 
Who came up with this greenhouse gas concept and how seriously is it taken?

Answer: According to physicist and historian Spencer Weart, the idea can be traced to French mathematician Joseph Fourier. Back in the 1820s, Fourier did some calculations to show that a rock like Earth orbiting at 93 million miles from the sun should be a big snowball. He suggested our balmy temperatures could be attributed to our atmosphere, which might hold in heat - sort of like a greenhouse.

There wasn't much experimental evidence to back this up until the 1850s, when British scientist John Tyndall started shining infrared light through various gases.

Tyndall knew the Earth absorbs solar radiation and emits infrared. If the greenhouse theory was right, gases that make up the atmosphere would absorb some of this infrared, thus raising the temperature.

At first he almost disproved the greenhouse effect by showing that infrared passes straight through oxygen and nitrogen - the main components of our atmosphere. But before he quit, Tyndall tried a few other gases, including CO2, and found it was a powerful absorber of infrared. Water vapor had the same property.

That suggested that while carbon dioxide makes up less than 0.001 percent of our atmosphere, it's working along with water vapor to prevent infrared radiation from escaping to space.

Climate change, minus the hot air - Taiwan News Online
 
Another dufuss who thinks the USA is the whole globe. :cuckoo:
glob-jan-dec-pg.gif

No, I put that graph there on purpose and it was labelled properly as being U.S. At least you were smart enough to realize that....most people are fooled by the Al Gores of the world when shown that graph....of course the U.S. is pointed out as being the big culprit of "global warming"....and so therefore the U.S. must pay big buck$ to other countries for our "sin" of "dangerously" heating up the climate....what a friggin' farce....this is nothing more than a world-wide rip-off....BIG hoaxes that rip-off BIG money (& power) need BIG scare tactics...

The chart you put up only goes back to the 1800s.....it also is a chart that is misleading and shows only a short approx 150 year span which is only a blip in the world's temperature history....showing a short cool period and then a short warming period....this kind of graph is also used to get people hyped up about global warming....charts can be very misleading....

Here is a much bigger historical chart (timewise) which spans several thousand years for world temps....do you see any problem with "global warming" in this chart? I don't...the world's temperature seems to be within the normal parameters of history....i suspect Al Gore may have invented "global warming" instead of the internet.....

who knows what the next few years will bring.....could get colder or could get warmer....i don't see any threat from CO2.....actually i hope it will get warmer....that would actually be quite nice for mankind....cold periods can be quite hard on people...

05f971b5ec196b8L.gif
I love it!!!!! You get caught trying to snooker people with a chart of the USA and Gore is at fault. even though he doesn't use your dishonest chart! :cuckoo::cuckoo::cuckoo::cuckoo::cuckoo::cuckoo:

And the chart I posted begins in the 1800s because it is a chart of DIRECT INSTRUMENT MEASUREMENT. Your new chart is made from proxy data, which has been shown to be unreliable for the time period where it overlaps with direct measurement (which of course is why deniers use it over direct measurement), thus casting into doubt the entire proxy chart. A perfect example of an error in your proxy chart is it shows 2005 as considerably colder than 1998 when 2005 is the warmest year in direct measurements and 2007 is tied with 1998 as the second warmest year.

So you are caught yet again with a deliberately misleading chart. I can't wait to see your rationalization for how Gore made you do it. :rofl:

You're nothing more than a deliberately myopic agw hack.....since when does late "direct instrument measurement" obfuscate the history of the earth obtained through other scientific means? Oh yeah....ever since your garbage got started....
Al-Gore-Explains-Cold-Weather-701167.jpg


so prove that temps have increased along with increasing CO2....even Gore can't explain it....

Global%20Cooling%20Graph.jpg


Another question for you....can you explain the "global warming" after the Little Ice Age? Obviously man-made CO2 emissions were not the cause of increasing temps back then...
 
Last edited:
No, I put that graph there on purpose and it was labelled properly as being U.S. At least you were smart enough to realize that....most people are fooled by the Al Gores of the world when shown that graph....of course the U.S. is pointed out as being the big culprit of "global warming"....and so therefore the U.S. must pay big buck$ to other countries for our "sin" of "dangerously" heating up the climate....what a friggin' farce....this is nothing more than a world-wide rip-off....BIG hoaxes that rip-off BIG money (& power) need BIG scare tactics...

The chart you put up only goes back to the 1800s.....it also is a chart that is misleading and shows only a short approx 150 year span which is only a blip in the world's temperature history....showing a short cool period and then a short warming period....this kind of graph is also used to get people hyped up about global warming....charts can be very misleading....

Here is a much bigger historical chart (timewise) which spans several thousand years for world temps....do you see any problem with "global warming" in this chart? I don't...the world's temperature seems to be within the normal parameters of history....i suspect Al Gore may have invented "global warming" instead of the internet.....

who knows what the next few years will bring.....could get colder or could get warmer....i don't see any threat from CO2.....actually i hope it will get warmer....that would actually be quite nice for mankind....cold periods can be quite hard on people...

05f971b5ec196b8L.gif
I love it!!!!! You get caught trying to snooker people with a chart of the USA and Gore is at fault. even though he doesn't use your dishonest chart! :cuckoo::cuckoo::cuckoo::cuckoo::cuckoo::cuckoo:

And the chart I posted begins in the 1800s because it is a chart of DIRECT INSTRUMENT MEASUREMENT. Your new chart is made from proxy data, which has been shown to be unreliable for the time period where it overlaps with direct measurement (which of course is why deniers use it over direct measurement), thus casting into doubt the entire proxy chart. A perfect example of an error in your proxy chart is it shows 2005 as considerably colder than 1998 when 2005 is the warmest year in direct measurements and 2007 is tied with 1998 as the second warmest year.

So you are caught yet again with a deliberately misleading chart. I can't wait to see your rationalization for how Gore made you do it. :rofl:

You're nothing more than a deliberately myopic agw hack.....since when does late "direct instrument measurement" obfuscate the history of the earth obtained through other scientific means? Oh yeah....ever since your garbage got started....
Al-Gore-Explains-Cold-Weather-701167.jpg


so prove that temps have increased along with increasing CO2....even Gore can't explain it....

Global%20Cooling%20Graph.jpg


Another question for you....can you explain the "global warming" after the Little Ice Age? Obviously man-made CO2 emissions were not the cause of increasing temps back then...

_____

Great question that opens up for reasonable and simple common sense regarding this issue - though a question largely avoided by the flat earth warmers.

The earth will cool and warm, and humankind's role in that process is minimal.

We can influence environment - we have very little impact on the climate.
 
No, I put that graph there on purpose and it was labelled properly as being U.S. At least you were smart enough to realize that....most people are fooled by the Al Gores of the world when shown that graph....of course the U.S. is pointed out as being the big culprit of "global warming"....and so therefore the U.S. must pay big buck$ to other countries for our "sin" of "dangerously" heating up the climate....what a friggin' farce....this is nothing more than a world-wide rip-off....BIG hoaxes that rip-off BIG money (& power) need BIG scare tactics...

The chart you put up only goes back to the 1800s.....it also is a chart that is misleading and shows only a short approx 150 year span which is only a blip in the world's temperature history....showing a short cool period and then a short warming period....this kind of graph is also used to get people hyped up about global warming....charts can be very misleading....

Here is a much bigger historical chart (timewise) which spans several thousand years for world temps....do you see any problem with "global warming" in this chart? I don't...the world's temperature seems to be within the normal parameters of history....i suspect Al Gore may have invented "global warming" instead of the internet.....

who knows what the next few years will bring.....could get colder or could get warmer....i don't see any threat from CO2.....actually i hope it will get warmer....that would actually be quite nice for mankind....cold periods can be quite hard on people...

05f971b5ec196b8L.gif
I love it!!!!! You get caught trying to snooker people with a chart of the USA and Gore is at fault. even though he doesn't use your dishonest chart! :cuckoo::cuckoo::cuckoo::cuckoo::cuckoo::cuckoo:

And the chart I posted begins in the 1800s because it is a chart of DIRECT INSTRUMENT MEASUREMENT. Your new chart is made from proxy data, which has been shown to be unreliable for the time period where it overlaps with direct measurement (which of course is why deniers use it over direct measurement), thus casting into doubt the entire proxy chart. A perfect example of an error in your proxy chart is it shows 2005 as considerably colder than 1998 when 2005 is the warmest year in direct measurements and 2007 is tied with 1998 as the second warmest year.

So you are caught yet again with a deliberately misleading chart. I can't wait to see your rationalization for how Gore made you do it. :rofl:

You're nothing more than a deliberately myopic agw hack.....since when does late "direct instrument measurement" obfuscate the history of the earth obtained through other scientific means? Oh yeah....ever since your garbage got started.....
Direct measurement has always been the standard proxy data is measured against.
You are obviously sore you were caught with your phony chart.
Of course, when caught with a phony chart, you simply post another phony chart.
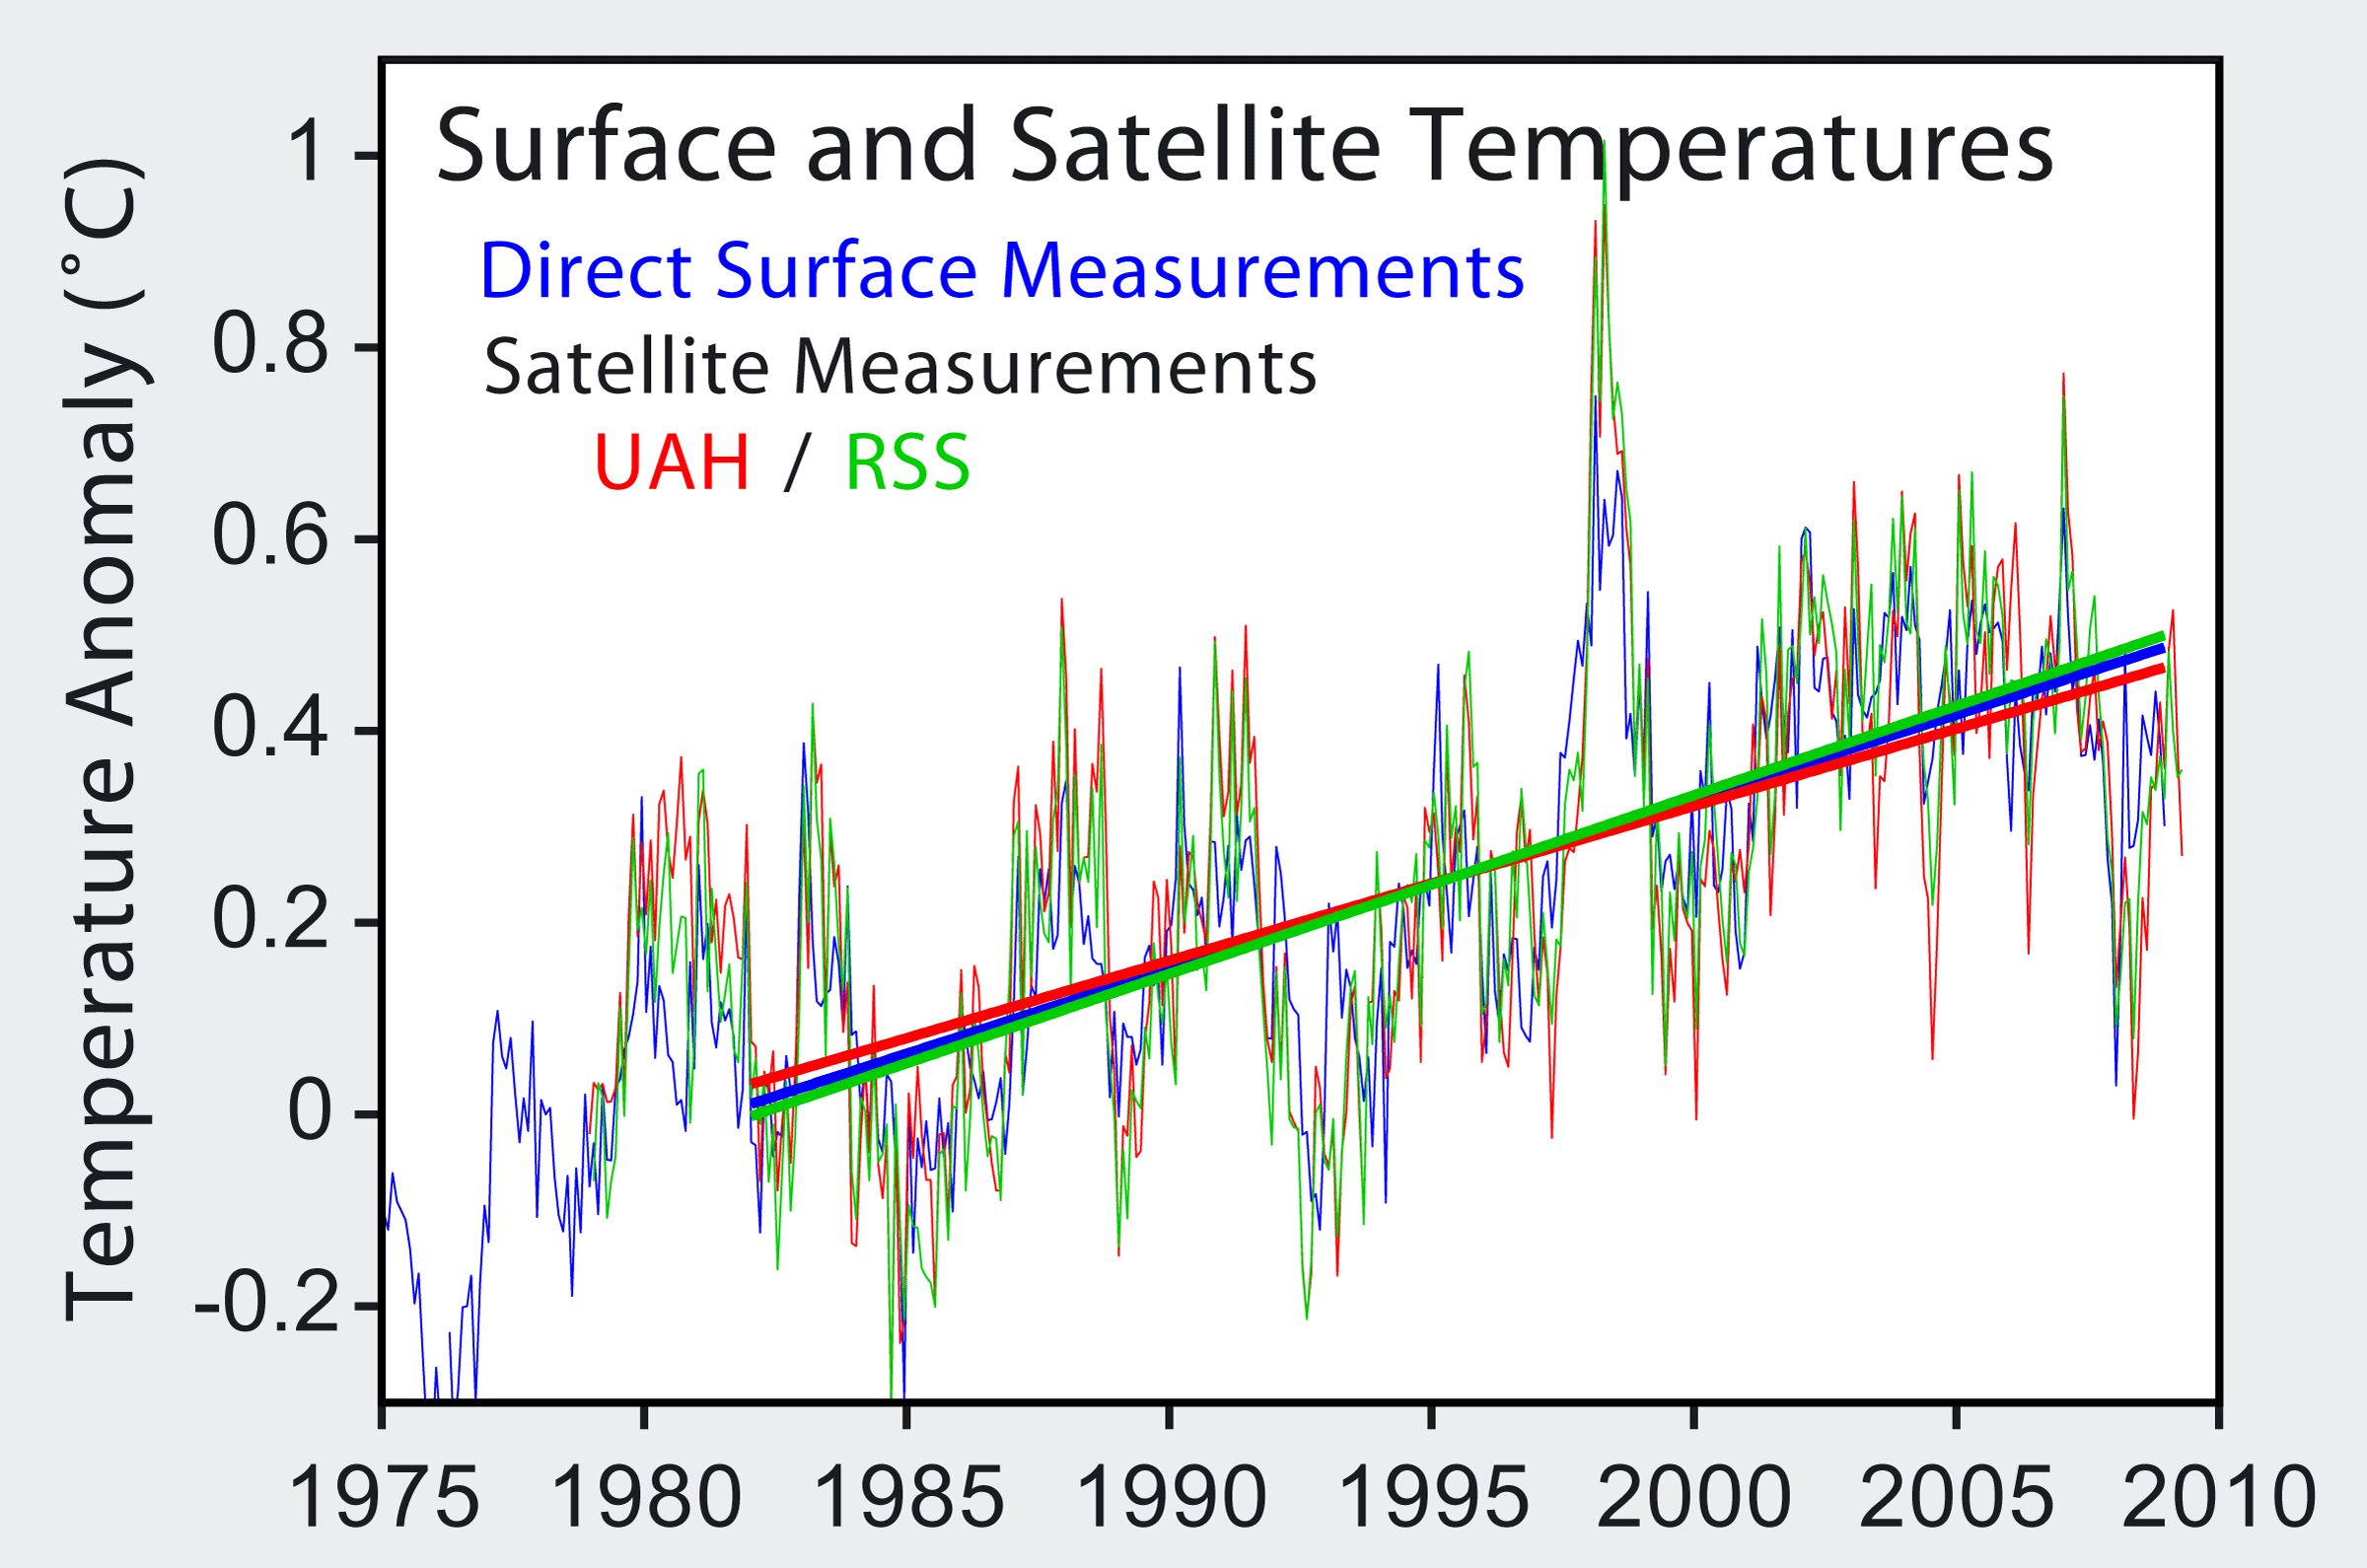
Here's a real chart.
Satellite_Temperatures.png
 
I love it!!!!! You get caught trying to snooker people with a chart of the USA and Gore is at fault. even though he doesn't use your dishonest chart! :cuckoo::cuckoo::cuckoo::cuckoo::cuckoo::cuckoo:

And the chart I posted begins in the 1800s because it is a chart of DIRECT INSTRUMENT MEASUREMENT. Your new chart is made from proxy data, which has been shown to be unreliable for the time period where it overlaps with direct measurement (which of course is why deniers use it over direct measurement), thus casting into doubt the entire proxy chart. A perfect example of an error in your proxy chart is it shows 2005 as considerably colder than 1998 when 2005 is the warmest year in direct measurements and 2007 is tied with 1998 as the second warmest year.

So you are caught yet again with a deliberately misleading chart. I can't wait to see your rationalization for how Gore made you do it. :rofl:

You're nothing more than a deliberately myopic agw hack.....since when does late "direct instrument measurement" obfuscate the history of the earth obtained through other scientific means? Oh yeah....ever since your garbage got started....
Al-Gore-Explains-Cold-Weather-701167.jpg


so prove that temps have increased along with increasing CO2....even Gore can't explain it....

Global%20Cooling%20Graph.jpg


Another question for you....can you explain the "global warming" after the Little Ice Age? Obviously man-made CO2 emissions were not the cause of increasing temps back then...

_____

Great question that opens up for reasonable and simple common sense regarding this issue - though a question largely avoided by the flat earth warmers.

The earth will cool and warm, and humankind's role in that process is minimal.

We can influence environment - we have very little impact on the climate.

----
 
Ed, I'm back Ed. Ed did you stop to look at your chart Ed? Ed your chart shows a decrease in anomaly temps since 2007 Ed. Ed your nice straight lines are rolling averages Ed. Ed? Do you like screwing yourself Ed?
 
I love it!!!!! You get caught trying to snooker people with a chart of the USA and Gore is at fault. even though he doesn't use your dishonest chart! :cuckoo::cuckoo::cuckoo::cuckoo::cuckoo::cuckoo:

And the chart I posted begins in the 1800s because it is a chart of DIRECT INSTRUMENT MEASUREMENT. Your new chart is made from proxy data, which has been shown to be unreliable for the time period where it overlaps with direct measurement (which of course is why deniers use it over direct measurement), thus casting into doubt the entire proxy chart. A perfect example of an error in your proxy chart is it shows 2005 as considerably colder than 1998 when 2005 is the warmest year in direct measurements and 2007 is tied with 1998 as the second warmest year.

So you are caught yet again with a deliberately misleading chart. I can't wait to see your rationalization for how Gore made you do it. :rofl:

You're nothing more than a deliberately myopic agw hack.....since when does late "direct instrument measurement" obfuscate the history of the earth obtained through other scientific means? Oh yeah....ever since your garbage got started.....
Direct measurement has always been the standard proxy data is measured against.
You are obviously sore you were caught with your phony chart.
Of course, when caught with a phony chart, you simply post another phony chart.
Here's a real chart.
Satellite_Temperatures.png

I'm not sore at all....my charts are fine.....yours is too....it shows the decline as well...

How about answering my question?
Can you explain the "global warming" after the Little Ice Age? Obviously man-made CO2 emissions were not the cause of increasing temps back then...

Or don't you believe the Little Ice Age happened because there are no "direct instrument measurements"?
 
You're nothing more than a deliberately myopic agw hack.....since when does late "direct instrument measurement" obfuscate the history of the earth obtained through other scientific means? Oh yeah....ever since your garbage got started.....
Direct measurement has always been the standard proxy data is measured against.
You are obviously sore you were caught with your phony chart.
Of course, when caught with a phony chart, you simply post another phony chart.
Here's a real chart.
Satellite_Temperatures.png

I'm not sore at all....my charts are fine.....yours is too....it shows the decline as well...
Only in bizarro-land!!!

The trend-line undeniably points UP.
 
You're nothing more than a deliberately myopic agw hack.....since when does late "direct instrument measurement" obfuscate the history of the earth obtained through other scientific means? Oh yeah....ever since your garbage got started.....
Direct measurement has always been the standard proxy data is measured against.
You are obviously sore you were caught with your phony chart.
Of course, when caught with a phony chart, you simply post another phony chart.
Here's a real chart.
Satellite_Temperatures.png

I'm not sore at all....my charts are fine.....yours is too....it shows the decline as well...

How about answering my question?
Can you explain the "global warming" after the Little Ice Age? Obviously man-made CO2 emissions were not the cause of increasing temps back then...

Or don't you believe the Little Ice Age happened because there are no "direct instrument measurements"?

The Little Ice Age happened because of volcanic eruptions near the equator.


The cooling that eventually led to the time known as the Little Ice Age started around the years 1100 to 1200 a.d. Round about 1600, the warming started up again.

Which eruptions are you citing and how long did they last?
 
:[/quote said:
You're nothing more than a deliberately myopic agw hack.....since when does late "direct instrument measurement" obfuscate the history of the earth obtained through other scientific means? Oh yeah....ever since your garbage got started.....
Direct measurement has always been the standard proxy data is measured against.
You are obviously sore you were caught with your phony chart.
Of course, when caught with a phony chart, you simply post another phony chart.
Here's a real chart.
Satellite_Temperatures.png


Two points:

The anamolies as measured by the two staelite sources and by the Land based stations seem to be pretty close. Why you routinely attack the data from the satelite stations escapes me.

The end of the graph using any data track shows that the warming has stalled.

Here are some actual numbers:

The Reference Frame: UAH MSU: temperatures for 2009 and ranking

Bonus: linear regression

As a bonus, I will list you the UAH warming trends (recalculated to temperature changes in °C per century) for various intervals:

1995-2009: +0.95 °C/century
1996-2009: +0.89 °C/century
1997-2009: +0.41 °C/century
1998-2009: -0.24 °C/century
1999-2009: +1.22 °C/century
2000-2009: +0.53 °C/century
2001-2009: -0.78 °C/century
2002-2009: -1.56 °C/century
2003-2009: -1.43 °C/century
2004-2009: -1.43 °C/century
2005-2009: -3.70 °C/century
2006-2009: -2.30 °C/century
2007-2009: -1.00 °C/century
2008-2009: +21.0 °C/century

Of course, the last one must be taken with a big grain of salt. ;-) Otherwise, you can see among these 14 trends, 6 are warming (generously counting the huge 2008-2009 trend as well) while 8 are cooling! ;-) I could be more quantitative but this is roughly what we mean by saying that there has been no statistically significant warming in the last 15 years.
 

Forum List

Back
Top