Weather Patterns - A Discussion

Science says that we are experiencing an almost unprecedented warming, that the primary cause is human GHG emissions from the combustion of fossil fuels and that we are at the very brink of being able to do anything significant about it. Rejecting THAT is defying science.
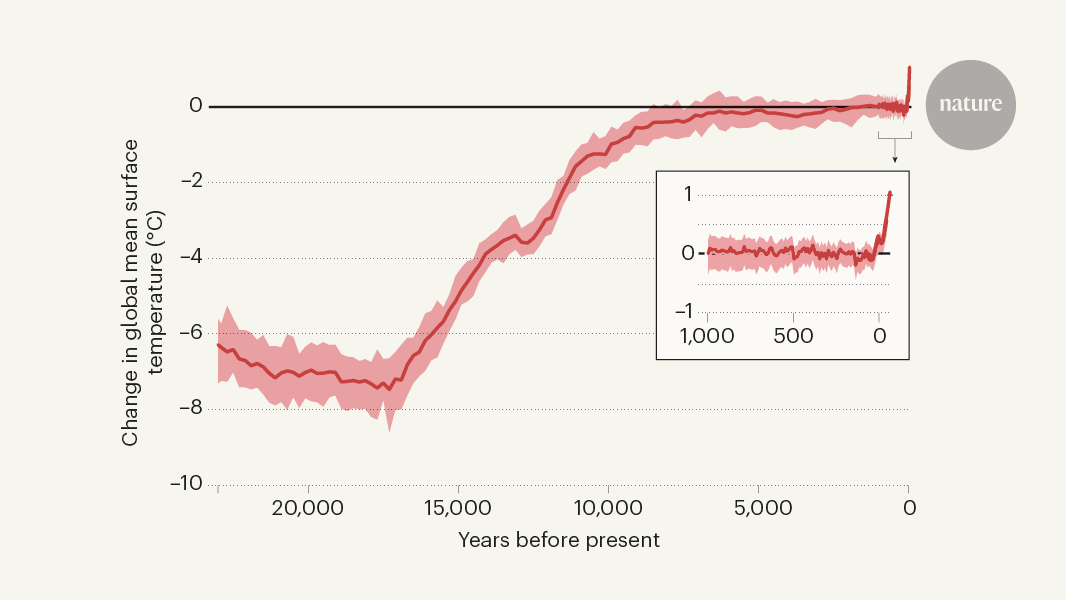
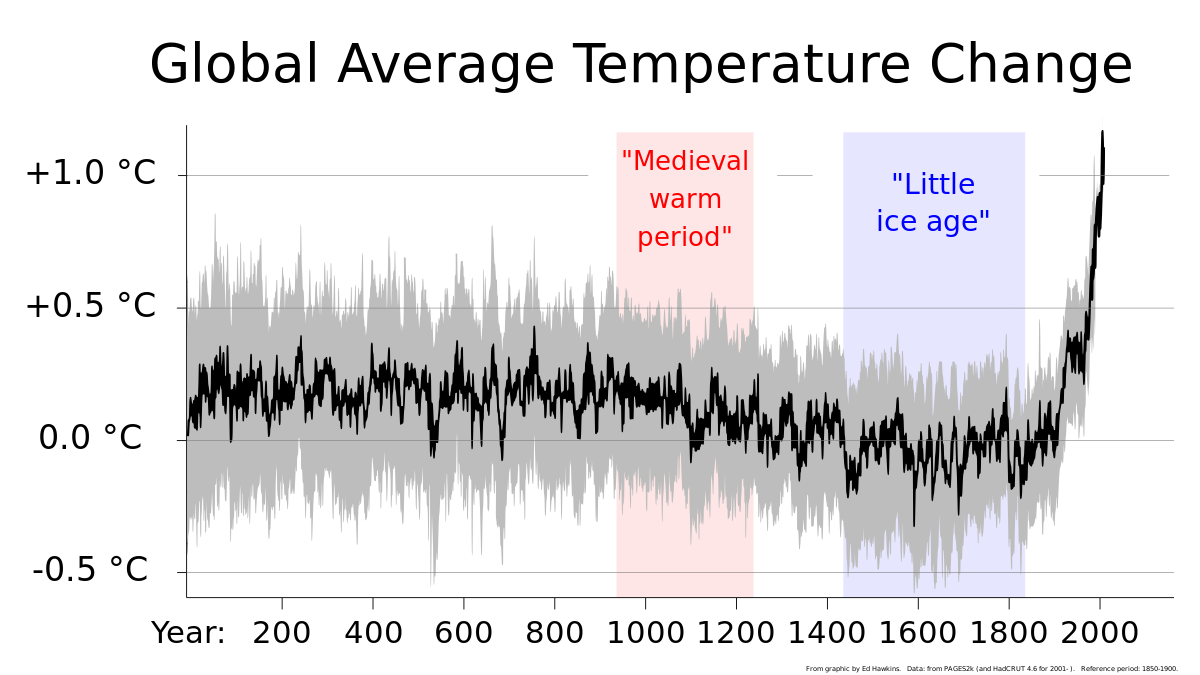
Other scientists reach opposite conclusions because they use the high variability solar output dataset that NASA uses and exclude urban temperature stations which are skewed by the urban heat island effect.

Your scientists use the low variability solar output dataset and include the urban heat island datasets. Plus your guys routinely adjust their model to tune out natural variation. They call it removing drift.

I have so much to teach you.
 
This is what it's done:
\View attachment 729126
View attachment 729128

This should worry you.


Science says that we are experiencing an almost unprecedented warming, that the primary cause is human GHG emissions from the combustion of fossil fuels and that we are at the very brink of being able to do anything significant about it. Rejecting THAT is defying science.

That is NOT a trivial amount of heating GIVEN THE RATE AT WHICH IT IS TAKING PLACE. And the same ongoing process that has created that 1.8 W/m^2 of heating is going to create a great deal more heating which will raise sea levels at an accelerating pace, will further increase the frequency and severity of weather events and which will do further damage to fresh water supplies, wildlife and agriculture.

The only power shortages people are suffering at present are due to Russia's response to western support of the Ukraine in the face of Putin's unprovoked imperialist invasion. Non-emitting technologies are replacing fossil fuels in transportation and energy generation. That will continue.

Your "mathematical" objection was debunked shortly before the turn of the 19th century.

Human GHG emissions and their effect on the planet's temperatures are synthetic, not natural.
Still ice in the Arctic?
 
Why do you think this is "extreme"? ... looks absolutely normal to me ... give or take 10ºC ...

The FALSEHOOD here is only using data from 1981 to 2010 ... go back to 1930 and we could show the exact opposite ... this is how we LIE with statistics, restricting the sample pool to drive up percentages, like the Monty Hall problem ...

How did we come by data in the polar regions? ... meteorologists "on the ice" has only been happening in the past twenty years or so ... and this has been limited by how goddam expensive it is to live in such places ... I wonder if Scott Duncun knows there's another half to Earth, with dark-skinned peoples ... or maybe he doesn't care about those places ...

Anything within 10ºC of average in normal and expected, at all time in all places ... what the egg-head sciency types call "high standard deviations" ...

If there is no polar temperature data prior to the satellite era, what authority tells you that looking back at 1930 would show the exact opposite?
 
If there is no polar temperature data prior to the satellite era, what authority tells you that looking back at 1930 would show the exact opposite?

Liars have to lie ...

The authority is NOAA's claim to the temperature record ... something you've referenced many many times ... except NOAA uses the 1901-2000 average as a base line ... you know, scientific, not hysterical ... just double the readings to account for Arctic Amplification ... or is that too much mathing for you during your period? ...

Hey Stupid ... there were thermometers on the DEW line ... you're just an ignorant ass aren't you ... ha ha ha ha ha ...

 
Why do you think this is "extreme"? ... looks absolutely normal to me ... give or take 10ºC ...

The FALSEHOOD here is only using data from 1981 to 2010 ... go back to 1930 and we could show the exact opposite ... this is how we LIE with statistics, restricting the sample pool to drive up percentages, like the Monty Hall problem ...
These data come from: Climate reanalysis | Copernicus. Data there are available over a range of time spans currently running from 1950 to the present. They will eventually have data back to 1940. The choice of 1981 - 2010 was the choice of whoever created that graphic, not the dataholder.
How did we come by data in the polar regions? ... meteorologists "on the ice" has only been happening in the past twenty years or so ... and this has been limited by how goddam expensive it is to live in such places
Satellite temperature data began in 1978, 44 years ago. The ERA5 dataset is a combination of historical instrument records and model output. From the top of the Copernicus website: "Climate reanalyses combine past observations with models to generate consistent time series of multiple climate variables. Reanalyses are among the most-used datasets in the geophysical sciences. They provide a comprehensive description of the observed climate as it has evolved during recent decades, on 3D grids at sub-daily intervals. "
... I wonder if Scott Duncun knows there's another half to Earth, with dark-skinned peoples ... or maybe he doesn't care about those places ...
Blatant ad hominem having nothing to do with the debate. And if you had actually visited the Twitter link you would see that he covers the entire planet quite thoroughly.
Anything within 10ºC of average in normal and expected, at all time in all places ... what the egg-head sciency types call "high standard deviations" ...
Do you have a link for that value, particularly as it applies to monthly averages?
From where did you get 10C is normal and expected deviation at all times and in all places?
 
These data come from: Climate reanalysis | Copernicus. Data there are available over a range of time spans currently running from 1950 to the present. They will eventually have data back to 1940. The choice of 1981 - 2010 was the choice of whoever created that graphic, not the dataholder.

Satellite temperature data began in 1978, 44 years ago. The ERA5 dataset is a combination of historical instrument records and model output. From the top of the Copernicus website: "Climate reanalyses combine past observations with models to generate consistent time series of multiple climate variables. Reanalyses are among the most-used datasets in the geophysical sciences. They provide a comprehensive description of the observed climate as it has evolved during recent decades, on 3D grids at sub-daily intervals. "

Blatant ad hominem having nothing to do with the debate. And if you had actually visited the Twitter link you would see that he covers the entire planet quite thoroughly.

Do you have a link for that value, particularly as it applies to monthly averages?

From where did you get 10C is normal and expected deviation at all times and in all places?
Still waiting to see where ReinyDays read that 10C is a normal and expected deviation at all times and in all places.
 

Forum List

Back
Top