Sunsettommy
Diamond Member
- Mar 19, 2018
- 14,884
- 12,518
- 2,400
NTZ
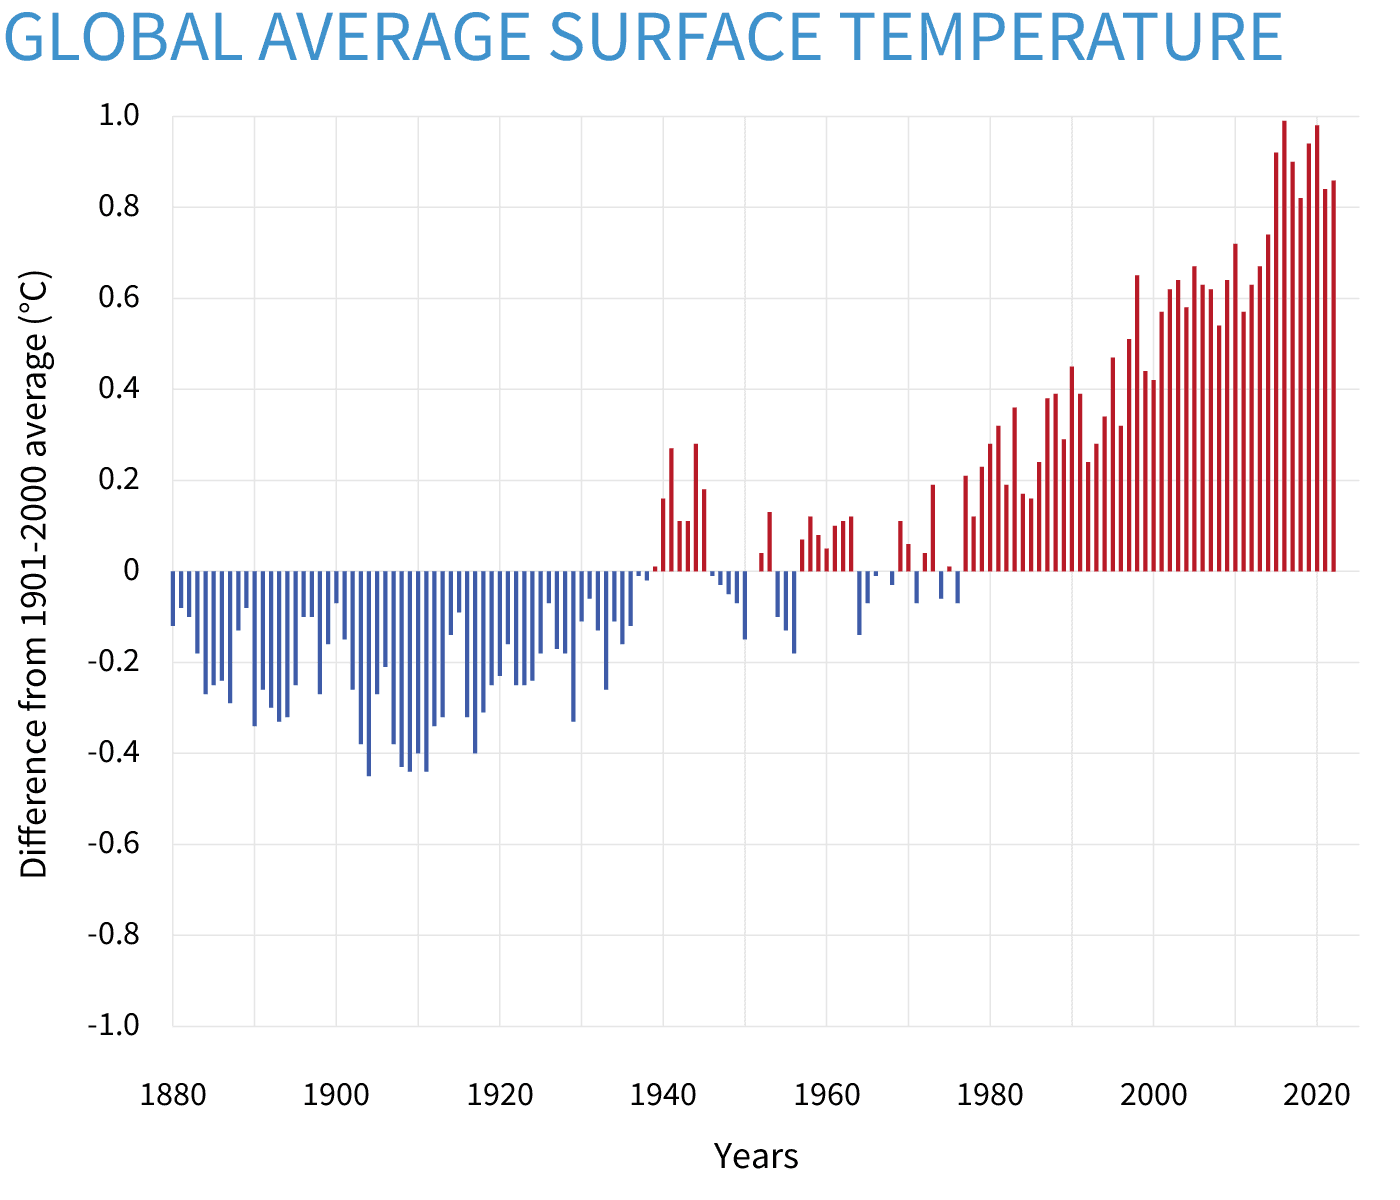
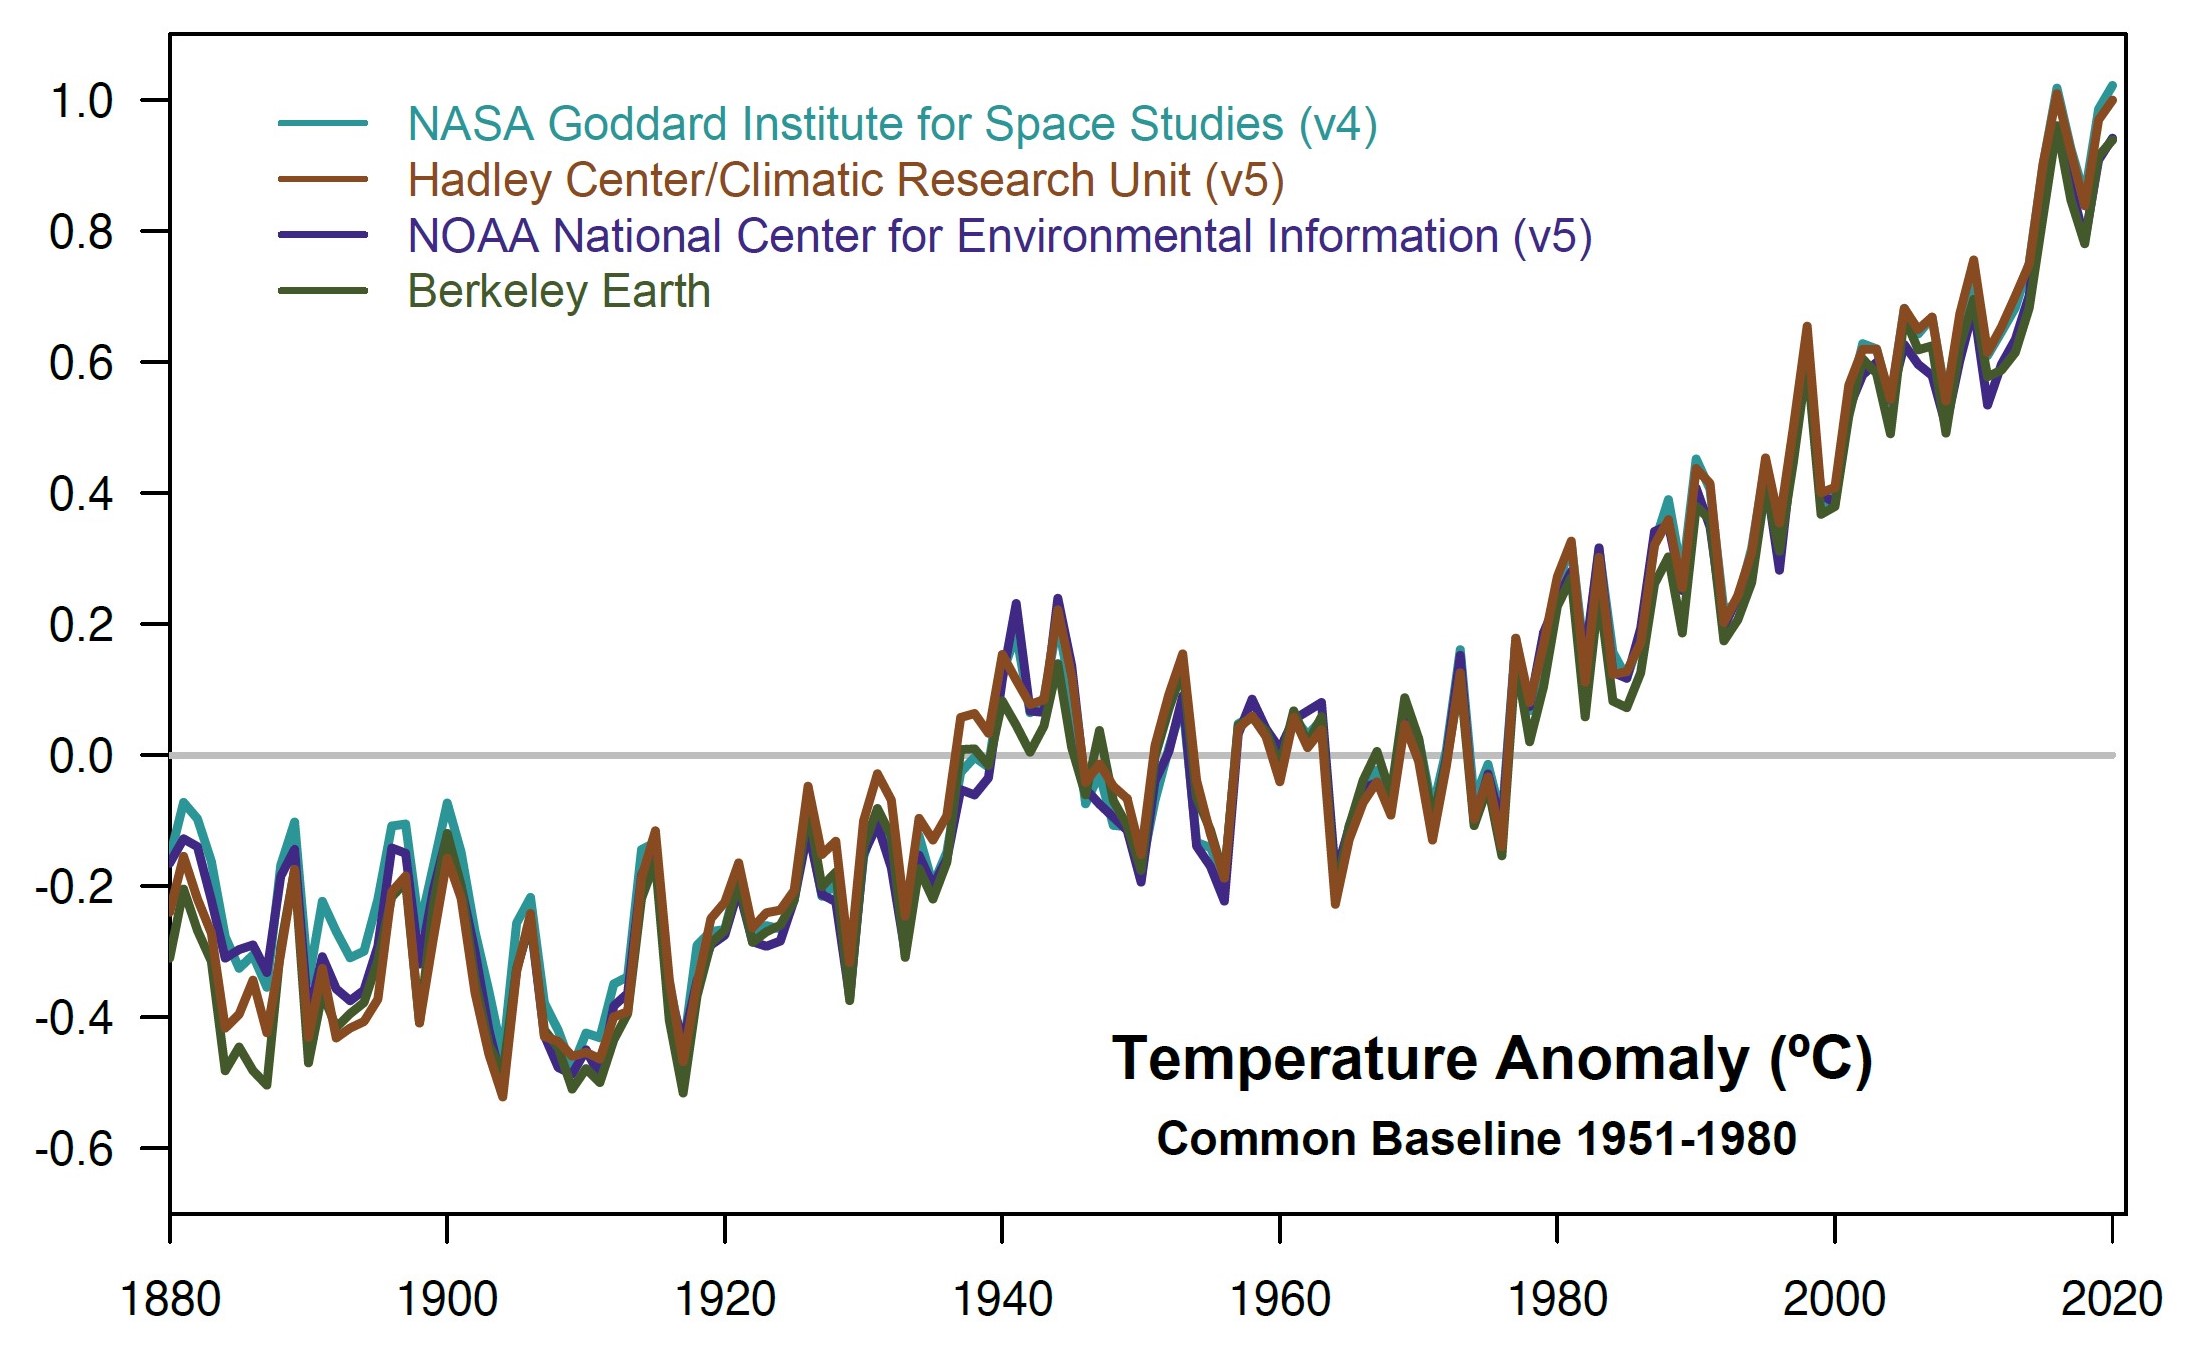
The HadCRUT4 Global Temperature Dataset Now Unveils A Cooling Trend For The Last 7.5 Years
By Kenneth Richard on 19. July 2021
Excerpt:

LINK
=====
Watch the CO2 haters scream against hard evidence.....
The HadCRUT4 Global Temperature Dataset Now Unveils A Cooling Trend For The Last 7.5 Years
By Kenneth Richard on 19. July 2021
Excerpt:
Since the last day of 2001 CO2 has risen from 372 to 419 ppm. However, there have been two cooling periods of 12 years (2002-2014) and 7.5 years (2014-2021), separated by a 1.5-year El Niño-induced warming event (2015-2016). Temperature changes that proceed in step- or event-like fashion do not seem to correlate well with linearly-rising CO2 concentrations.
HadCRUT4 temperature data (made available for public use by WoodForTrees.org) now presents a slight cooling trend since the first few months of 2014.LINK
=====
Watch the CO2 haters scream against hard evidence.....