The Bogus practice of posting Local/Regional Daily Weather as proof/disproof of GW/AGW

Climate Central is grossly exaggerating NOAA's temperature averages ... you didn't notice? ...

The 2010's average temperature is only 0.7ºC above the 1901-2000 baseline ... and only 0.9ºC above the "adjusted" baseline Comedy Central uses ... with a 0.13ºC standard deviation ... oh, and we still have the ±0.5ºC instrumentation error ... and this was true back on Jan 15th, 2020 ... NOAA's data hasn't changed since then* ...

I can't believe you missed that ... do you only pay attention to people who agree with you? ... you should know that it's statistical fraud to change the "zero reference" on a chart like this ... you'd be screaming a red fury if I adjusted that to the 1990 - 2010 average and pointed out there's only 0.1ºC warming ...

* = We should probably expect some small changes in this data later this year or next ... Oakridge has a new fast big exoscale computer coming on-line soon ... and DoE is mandated to share with NOAA ... just depends on how soon NOAA gets around to updating these global temperature figures ... there's always a big blow up when this happens and it's NOT because NOAA is manipulating the data ...
I answered very fully, even candidly, including on "8th warmest."
Then put up my own charts which, no matter how you ant to pervert them all say the same thing

Here ya go.
Dis NASA!
Even better/Reiny-busting chart.
Do you notice a trend?
Anything at all?


1641410535764.png


What will you try now?

`
 
I answered very fully, even candidly, including on "8th warmest."
Then put up my own charts which, no matter how you ant to pervert them all say the same thing

Here ya go.
Dis NASA!
Even better/Reiny-busting chart.
Do you notice a trend?
Anything at all?


View attachment 583911


What will you try now?

`

Thank you ... though you still haven't stated what time period you want to use nor have you posted the average temperatures using that time period ... do you not know how to calculate averages, or do the averages you get confirm my claims? ...

This new chart is an exact duplicate of NOAA's data ... do you know why? ... simple, NASA doesn't have a world-wide network of operating weather stations ... the American tax-payers only built one, and this they gave to NOAA to use ... why on Earth did you think any differently? ...

Second, this uses a 30 year baseline ... and this 30-year time interval clearly shows our counter-example ... see how temperatures went down between 1940 and 1980, and this was a time of extensive civil destruction and re-building, and all the carbon pollution that comes with manufactureing a B-17 heavy bomber every fifteen minutes ... what physics caused this period of global cooling in spite increasing GHG's? ...

=====

And thank you for having "the talk" with Old Rocks ... he's a great poster when he stays within himself ... my fellow Denialists know I'll tear into their shit just as quick as any, AND I'll do so publickally ... [giggle] ... none of this pussy PM-ing for me, the only time I use PM is when I'm feeding trolls ... I'm here to protect the basic science, the cube of the semi-major axis is equal to the square of the period, and it's just shameful that the basic science needs protecting, PV is always equal to nRT ...

I know you can calculate averages, what I don't think you can calculate is the number of joules in your chart above ... because if you did do these calculations, you'd see why I say there's NO climate catastrophe of any kind ... not enough power ... energy and power are two different things ... you should know that from first year physics ...
There's an average on the above chart based in 1951-1980 because we have actual temps for that period (alone) and it's about the center of emissions for the industrial Revolution. You want to throw alot of ambiguation around instead of explanation to avoid the fact it's undeniably warming faster and GHG concentration going up faster than any past period.

If you had read any of the links in my "How do we know humans..." thread, a few of my posts in it and elsewhere, I have given a condensed version (a 'Jewel') of How we know.

Among the sane there is only GW and AGW, no cooling since the I-Rev got seriously underway. 90-something percent of climate scientists and 100% of Intl Sci orgs say it is in good part human caused: AGW.

How do we/they know? Scientists have looked at past warming cycles and they were caused by the the earths orbital position/increased solar radiation/"forcing." That is Not true of this one.

Usually that solar forcing sets loose the Greenhouse Gases (CO2, CH4, Water vapor, etc) ("trailing indicators") which dramatically increases the warming. This time however, solar radiation has Not increased but the trapping effect of the GHG's we have pumped at an unprecedented rate/speed into the atmo has.

Co2 has increased from 280 PPM in 1850 to over 410 PPM now: the Industrial Revolution. Most of it the last 70 yrs.
Sci guys have measured the radiation-in: (stable), and radiation-out: (partly but increasingly blocked from reflecting back into space at the precise spectral wavelengths of the increasing concentration of the GHGs.)

It can go up and down somehwhat but the blanket gets thicker every year.

More:
Some scientists think the 20th C would have been cooler were it not for us.
So the 'part' of warming caused by humans may actually be more than 'some,' 'most,' or even 'all,' but, ie, 120%.
Something few non-climate scis consider.


`
 
Last edited:
Is Rampant here especially among Warming deniers.
("It's cold/snowed in Alaska today")
It has no place in the section.
Should be deleted/banned.
Weather is still 'environment' but NOT 'Climate' UNLESS a case can be made that we're having, ie, more tornados over a Longer period BECAUSE of it.

There are daily and whole threads here doing so. The Stupidest one, an 8 YEAR BLOG - and running - with help from the board's worst clowns, that not only denies AGW but GW by using Short Term local, regional, or Backyard cold weather events.

Let's refrain from this, or better yet post a Sticky saying threads/posts of this nature will be Deleted.

`
just post one location where climate changed.
 
just post one location where climate changed.
Unfortunately when one puts a one-line POS troll like you on ignore you can still see and comment on mine.
So I took you Skooker and Toddster off for a week.,
But you're now Back on.
I am putting YOU, Skooker, and Toddster back on ignore because you are all NOTHING but high frequency posting Trolls.
You will not get any answers.
In your whole lifetime and 10 more, none of you would have 10% of the brains/knowledge to write the post I did above.
You are not serious. You are all low IQ juvenile baiting ***holes
GOODBYE.
size=6


PS: for other serious posters here.
The board clears rather nicely/reads much more intelligently when you put jc456, Skookerasbil, and ToddsterPatriot on Ignore.

`
 
Last edited:
Unfortunately when one puts a one-line POS troll like you on ignore you can still see and comment on mine.
So I took you Skooker and Toddster off for a week.,
But you're now Back on.
I am putting YOU, Skooker, and Toddster back on ignore because you are all NOTHING but high frequency posting Trolls.
You will not get any answers.
In your whole lifetime and 10 more, none of you would have 10% of the brains/knowledge to write the post I did above.
You are not serious. You are all low IQ juvenile baiting ***holes
GOODBYE.

`
so no place has climate that actually changed, right? cause you reacted like I handed you your dick.
 
There's an average on the above chart based in 1951-1980 because we have actual temps for that period (alone) and it's about the center of emissions for the industrial Revolution. You want to throw alot of ambiguation around instead of explanation to avoid the fact it's undeniably warming faster and GHG concentration going up faster than any past period.

If you had read any of the links in my "How do we know humans..." thread, a few of my posts in it and elsewhere, I have given a condensed version (a 'Jewel') of How we know.

Among the sane there is only GW and AGW, no cooling since the I-Rev got seriously underway. 90-something percent of climate scientists and 100% of Intl Sci orgs say it is in good part human caused: AGW.

How do we/they know? Scientists have looked at past warming cycles and they were caused by the the earths orbital position/increased solar radiation/"forcing." That is Not true of this one.

Usually that solar forcing sets loose the Greenhouse Gases (CO2, CH4, Water vapor, etc) ("trailing indicators") which dramatically increases the warming. This time however, solar radiation has Not increased but the trapping effect of the GHG's we have pumped at an unprecedented rate/speed into the atmo has.

Co2 has increased from 280 PPM in 1850 to over 410 PPM now: the Industrial Revolution. Most of it the last 70 yrs.
Sci guys have measured the radiation-in: (stable), and radiation-out: (partly but increasingly blocked from reflecting back into space at the precise spectral wavelengths of the increasing concentration of the GHGs.)

It can go up and down somehwhat but the blanket gets thicker every year.

More:
Some scientists think the 20th C would have been cooler were it not for us.
So the 'part' of warming caused by humans may actually be more than 'some,' 'most,' or even 'all,' but, ie, 120%.
Something few non-climate scis consider.


`

Thank you for this thoughtful post ... let me take the time to respond:

There's an average on the above chart based in 1951-1980 because we have actual temps for that period (alone) and it's about the center of emissions for the industrial Revolution. You want to throw alot of ambiguation around instead of explanation to avoid the fact it's undeniably warming faster and GHG concentration going up faster than any past period.

The average used on NOAA's chart is 1901-2000 ... we have actual temperatures for that period ... which do you think is a better standard? ... I'm not being ambiguous, I'm being interrogatory ... you just refuse to answer the question posed by your own OP ... what time interval is appropriate for calculating our climate averages, and what averages do you get with this time interval ...

Can I see your math that shows "the fact it's undeniably warming faster" ... NOAA's numbers give this distinction for the period 1910-1940 at +0.23ºC/decade ... for the period 1980-2020 we have only seen +0.18ºC/decade ... I will always deny that 0.18 is larger than 0.23 ... you should too or you'll look like a moron ... oh, you still have to explain the physics that caused the global cooling between 1940 -1980 at -0.06ºC/decade ...

ha ha ha ha ... yes, I certainly would like us to agree to use a shorter time interval ... 30 years gives me a counter-example to mash into your face ... but this is still "in the weeds" of the dynamic considerations ... not all solar cycles or El Nino/La Nina cycles are the same ... and the more of these cycles we include in our averages, the less effect they will have on those averages ... thus using the 70-year interval for our averages gives us a better shot at leveling these cycles out, and yet still serve the purpose of establishing global warming ...

Sounds to me like you've already came to your conclusions ... and are just hunting around for the best statistics to support your cause ... a well known trick of the statistical arts is to reduce your sample pool to drive up probabilities ... we all know the past 40 years looks bad, but compared to the past 10,000 not-so-much of a big deal ...

=====

HAW HAW HAW ... the 2020 North Atlantic Hurricane Season was ...

( ... wait for it ... )

COMPLETELY
NORMAL


God that's funny ...
 
Thank you for this thoughtful post ... let me take the time to respond:

There's an average on the above chart based in 1951-1980 because we have actual temps for that period (alone) and it's about the center of emissions for the industrial Revolution. You want to throw alot of ambiguation around instead of explanation to avoid the fact it's undeniably warming faster and GHG concentration going up faster than any past period.

The average used on NOAA's chart is 1901-2000 ... we have actual temperatures for that period ... which do you think is a better standard? ... I'm not being ambiguous, I'm being interrogatory ... you just refuse to answer the question posed by your own OP ... what time interval is appropriate for calculating our climate averages, and what averages do you get with this time interval ...

Can I see your math that shows "the fact it's undeniably warming faster" ... NOAA's numbers give this distinction for the period 1910-1940 at +0.23ºC/decade ... for the period 1980-2020 we have only seen +0.18ºC/decade ... I will always deny that 0.18 is larger than 0.23 ... you should too or you'll look like a moron ... oh, you still have to explain the physics that caused the global cooling between 1940 -1980 at -0.06ºC/decade ...

ha ha ha ha ... yes, I certainly would like us to agree to use a shorter time interval ... 30 years gives me a counter-example to mash into your face ... but this is still "in the weeds" of the dynamic considerations ... not all solar cycles or El Nino/La Nina cycles are the same ... and the more of these cycles we include in our averages, the less effect they will have on those averages ... thus using the 70-year interval for our averages gives us a better shot at leveling these cycles out, and yet still serve the purpose of establishing global warming ...

Sounds to me like you've already came to your conclusions ... and are just hunting around for the best statistics to support your cause ... a well known trick of the statistical arts is to reduce your sample pool to drive up probabilities ... we all know the past 40 years looks bad, but compared to the past 10,000 not-so-much of a big deal ...

=====
You're getting caught up in "average" when it/they were just used to simplify/show something in the middle time and warm-wise on Charts. Show how the planet has/IS warming. The decades anywhere in the middle would do as long as not solely an anomalous period due la nina etc. One could alos just start at the bottom or top temp/time.
No matter the 'average,' on the left are cooler earlier years, on the right warmer and warmer later years: warming over time.

That it IS warming is beyond dispute.
That warming is accelerating (along with GHGs) (and along with Sea Level rise) is Not in dispute.

Despite thanking for a serious reply you give me Two sets of "Ha ha/Haw Haw".
Here all your modern decades.


1641668512289.png


HAW HAW HAW ... the 2020 North Atlantic Hurricane Season was ...
( ... wait for it ... )

COMPLETELY
NORMAL

God that's funny ...
"Completely Normal?
"HAW HAW HAW?"

Misleading and not the point really.
'Hurricanes' aren't the only activity, most are 'merely 'Named Storms.'


Wiki:
""The 2021 Atlantic Hurricane season was the third-most active Atlantic Hurricane season on Record, producing 21 named storms, and the Second in a Row after 2020, and Third overall, in which the designated 21-name list of storm names was exhausted.[1][2]
It was also the Sixth Consecutive Year in which there was Above-Average tropical cyclone activity.[nb 2][1]""


I love this debate stuff.

Not only that, Hurricane seasons could change with atmospheric conditions/winds and warming.
Even tho they/storms AREN'T getting less, they could due to changing wind currents that sometimes block them.
Just like snow is not an indicator of cold.
Snow likes/needs warmer moister air. (Skooker's idiotic 75")
The coldest days I've seen in my long life were cloudless high pressure fronts from the North.
Active 'Weather' is generally caused by the energy of warmer moister air.


`
 
Last edited:
Thank you ... though you still haven't stated what time period you want to use nor have you posted the average temperatures using that time period ... do you not know how to calculate averages, or do the averages you get confirm my claims? ...

This new chart is an exact duplicate of NOAA's data ... do you know why? ... simple, NASA doesn't have a world-wide network of operating weather stations ... the American tax-payers only built one, and this they gave to NOAA to use ... why on Earth did you think any differently? ...

Second, this uses a 30 year baseline ... and this 30-year time interval clearly shows our counter-example ... see how temperatures went down between 1940 and 1980, and this was a time of extensive civil destruction and re-building, and all the carbon pollution that comes with manufactureing a B-17 heavy bomber every fifteen minutes ... what physics caused this period of global cooling in spite increasing GHG's? ...

=====

And thank you for having "the talk" with Old Rocks ... he's a great poster when he stays within himself ... my fellow Denialists know I'll tear into their shit just as quick as any, AND I'll do so publickally ... [giggle] ... none of this pussy PM-ing for me, the only time I use PM is when I'm feeding trolls ... I'm here to protect the basic science, the cube of the semi-major axis is equal to the square of the period, and it's just shameful that the basic science needs protecting, PV is always equal to nRT ...

I know you can calculate averages, what I don't think you can calculate is the number of joules in your chart above ... because if you did do these calculations, you'd see why I say there's NO climate catastrophe of any kind ... not enough power ... energy and power are two different things ... you should know that from first year physics ...
LOL Ever hear of satellites? You know, those things that have been orbiting the Earth ever since Sputnik? And the ones that have been taking air temperatures and measuring extent of ice since 1979.
 
You're getting caught up in "average" when it/they were just used to simplify/show something in the middle time and warm-wise on Charts. Show how the planet has/IS warming. The decades anywhere in the middle would do as long as not solely an anomalous period due la nina etc. One could alos just start at the bottom or top temp/time.
No matter the 'average,' on the left are cooler earlier years, on the right warmer and warmer later years: warming over time.

That it IS warming is beyond dispute.
That warming is accelerating (along with GHGs) (and along with Sea Level rise) is Not in dispute.

Despite thanking for a serious reply you give me Two sets of "Ha ha/Haw Haw".
Here all your modern decades.


View attachment 585383


"Completely Normal?
"HAW HAW HAW?"

Misleading and not the point really.
'Hurricanes' aren't the only activity, most are 'merely 'Named Storms.'


Wiki:
""The 2021 Atlantic Hurricane season was the third-most active Atlantic Hurricane season on Record, producing 21 named storms, and the Second in a Row after 2020, and Third overall, in which the designated 21-name list of storm names was exhausted.[1][2]
It was also the Sixth Consecutive Year in which there was Above-Average tropical cyclone activity.[nb 2][1]""


I love this debate stuff.

Not only that, Hurricane seasons could change with atmospheric conditions/winds and warming.
Even tho they/storms AREN'T getting less, they could due to changing wind currents that sometimes block them.
Just like snow is not an indicator of cold.
Snow likes/needs warmer moister air. (Skooker's idiotic 75")
The coldest days I've seen in my long life were cloudless high pressure fronts from the North.
Active 'Weather' is generally caused by the energy of warmer moister air.


`

Sure ... I understand ... averages don't say what you want them to say, so averages aren't important anymore ... plus you desperately needed to get back to screaming about single year data ... all this about the 2021 Hurricane season is a great example of your complaints in the OP ... (7 hurricanes is dead average, 4 majors is one over average ... yeah, I missed the extra Tropical Storms ... these don't show up very well in the ACE data) ...

Active 'Weather' is generally caused by the energy of warmer moister air.

Here's your mistake ... this is how we know you have no formal training in physics ... early on we clearly define things like force, energy, power and work ... energy alone won't do any of this ... we need to have energy moving from one place to another = power ... weather is caused by warmer moister air changing into colder drier air ... "change" is also a word very strictly defined in physics ...

It's a shame we can't use the language of mathematics ... otherwise the the difference is simple to state ... weather uses dt, climate uses ∆t ... everything else is exactly the same ... this thread is about what ∆t equals is all ...
 
Sure ... I understand ... averages don't say what you want them to say, so averages aren't important anymore ... plus you desperately needed to get back to screaming about single year data ... all this about the 2021 Hurricane season is a great example of your complaints in the OP ... (7 hurricanes is dead average, 4 majors is one over average ... yeah, I missed the extra Tropical Storms ... these don't show up very well in the ACE data) ...
Averages is just app where they draw the center horizontal line in the graph.
But Temp moves from the lower left to the upper right over time no matter what calls the avg.
It's warming.
You lose.


Active 'Weather' is generally caused by the energy of warmer moister air.

Here's your mistake ... this is how we know you have no formal training in physics ... early on we clearly define things like force, energy, power and work ... energy alone won't do any of this ... we need to have energy moving from one place to another = power ... weather is caused by warmer moister air changing into colder drier air ... "change" is also a word very strictly defined in physics ...

It's a shame we can't use the language of mathematics ... otherwise the the difference is simple to state ... weather uses dt, climate uses ∆t ... everything else is exactly the same ... this thread is about what ∆t equals is all ...
It's a shame you think anyone needs a degree to understand the the stored energy of warmer air and water are the potential and the Fuel for more and more severe weather.
That's what's been happening in the tropics the last 6 years in a row, the most active in named storms ever. (they ran out of Greek letters twice)
Weather and climate models use air and water temp to predict weather events and severity.
The warmer the water, the happier the Hurricane.


`
 
Last edited:
Averages is just app where they draw the center horizontal line in the graph.
But Temp moves from the lower left to the upper right over time no matter what calls the avg.
It's warming.
You lose.


It's a shame you think anyone needs a degree to understand the the stored energy of warmer air and water are the potential and the Fuel for more and more severe weather.
That's what's been happening in the tropics the last 6 years in a row, the most active in named storms ever. (they ran out of Greek letters twice)
Weather and climate models use air and water temp to predict weather events and severity.
The warmer the water, the happier the Hurricane.


`

A blind person can't see the minima at 1910 and 1980, and a maxima at 1940? ... if you never admit they exist, you can always deny them ... like St. Peter ... you have your fingers in your ears screaming "nah nah nah, I can't hear you, so you lose" ... one way to play a game I guess ...

Are Middle Schoolers still using "named storms" as a metric? ... [yawn] ... big boys and scientists use ACE:


Looks to me the past 6 years have been around the first deviation ... normal as normal can be ... statistically speaking that is ...

=====

Your OP is bitching about Denialists using 6 years of data ... and here you turn around and use 6 years of data to make your own point ... too funny ... can you at least try to not be a complete hypocrite in your own thread? ... please ...
All graphs/trends have bumps. (anomalies like solar minima, la nina, etc)
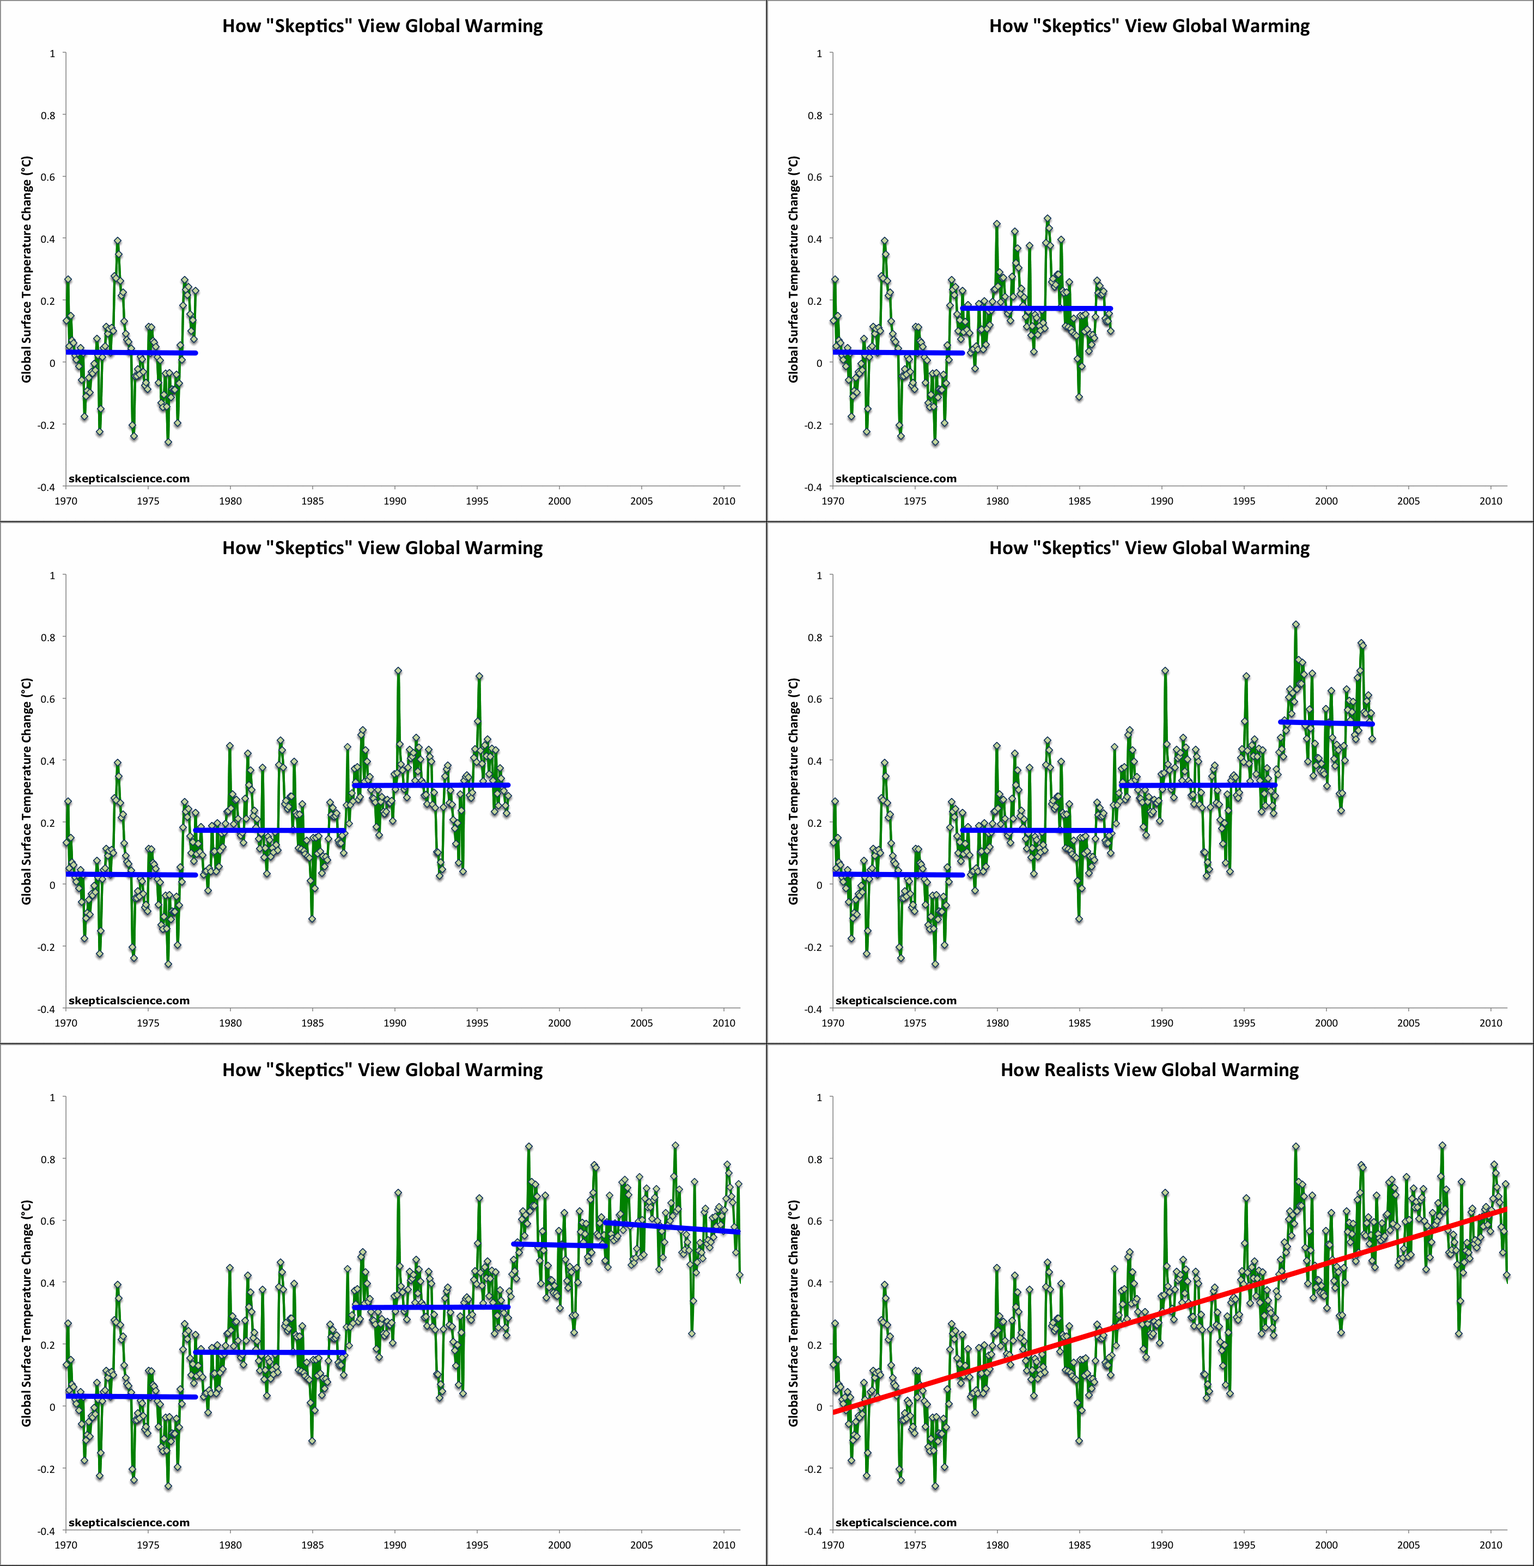
Already covered in a thread

Scientists call it "going down the Up Escalator."
Denialists look at/cite Statistically-Too-Short, flat-to-down trends in what IS actually a much more stable and unmistakable medium and long term Heating trend.

They talk about a "Pause", which is not so. It's just that nothing goes straight up.

Still Going Down the Up Escalator
3 February 2012

The Escalator, originally created as a simple debunking to the myth "Global warming stopped in [insert date]", turned out to be a very popular graphic. Going Down the Up Escalator, Part 1 recently surpassed 20,000 pageviews, Part 2 has an additional 4,000+ views, and the graphic itself has been used countless times in other blogs and media articles. Due to its popularity, we have added a link to The Escalator in the right margin of the page, and it also has its own short URL, sks.to/escalator.

The popularity of the graphic is probably due to the fact that (1) it's a simple, stand-alone debunking of the "global warming stopped" myth, and (2) that particular myth has become so popular amongst climate denialists. As The Escalator clearly illustrates, it's easy to cherry pick convenient start and end points to obtain whatever short-term trend one desires, but the long-term human-caused global warming trend is quite clear underneath the short-term noise.

The original Escalator was based on the Berkeley Earth Surface Temperature (BEST) data, which incorporates more temperature station data than any other data set, but is limited to land-only data; additionally the record terminates in early 2010. We originally created the graphic in response to thespecific myth that the BEST data showed that global warming had stopped.


NCDC_Escalator.gif


`
 
Last edited:
All graphs/trends have bumps. (anomalies like solar minima, la nina, etc)
Already covered in a thread

Scientists call it "going down the Up Escalator."
Denialists look at/cite Statistically-Too-Short, flat-to-down trends in what IS actually a much more stable and unmistakable medium and long term Heating trend.

They talk about a "Pause", which is not so. It's just that nothing goes straight up.

Still Going Down the Up Escalator
3 February 2012

The Escalator, originally created as a simple debunking to the myth "Global warming stopped in [insert date]", turned out to be a very popular graphic. Going Down the Up Escalator, Part 1 recently surpassed 20,000 pageviews, Part 2 has an additional 4,000+ views, and the graphic itself has been used countless times in other blogs and media articles. Due to its popularity, we have added a link to The Escalator in the right margin of the page, and it also has its own short URL, sks.to/escalator.

The popularity of the graphic is probably due to the fact that (1) it's a simple, stand-alone debunking of the "global warming stopped" myth, and (2) that particular myth has become so popular amongst climate denialists. As The Escalator clearly illustrates, it's easy to cherry pick convenient start and end points to obtain whatever short-term trend one desires, but the long-term human-caused global warming trend is quite clear underneath the short-term noise.

The original Escalator was based on the Berkeley Earth Surface Temperature (BEST) data, which incorporates more temperature station data than any other data set, but is limited to land-only data; additionally the record terminates in early 2010. We originally created the graphic in response to thespecific myth that the BEST data showed that global warming had stopped.


NCDC_Escalator.gif


`
Climate fluctuations and environmental uncertainty are hallmarks of the bipolar glaciated world we live in. You have mistakenly correlated natural climate fluctuations of a bipolar glaciated world with CO2.
 
All graphs/trends have bumps. (anomalies like solar minima, la nina, etc)
Already covered in a thread

The standard deviation is the establish method from mathematically stating the "bumpiness" of these graphs ...

Why the hell do you think solar minima is an anomaly? ... HAW HAW HAW HAW HAW HAW HAW ... solar minima occurs every 11 years like clockwork ... about as normal as normal can be ... there's your problem, even though all our data is as bumpy as can be, you still think normal is flat without bumps ... silly ...

The stupid part is I'm advocating a time interval that demonstrates global warming ... ∆t = 70 years gives us a +0.9ºC temperature increase ... do you disagree? ... if so, please state what you think our ∆t should be ...

=====

Cute graph in your last post ... go back another 40 years in time and your argument complete fails ... laughable ... oh, SB is a fourth root function, not linear like you claim with the red line ... if you put thi sin another post, you were wrong there too ...
You're idiotically caught up on averages and on an exact date to start.
Or should I say trying the usual Disingenuity.

As I said Many times, and as would be expect in AGW, the temps move up over time (I-Rev time) (with the CO2/GHGs) with the occasional lumps or bumps in all true trends

No matter how much idiocy/demand-detail-fallacy you throw at it, it dos not refute AGW.

`

The hypocritcy here is I'm claiming 1ºC of AGW in the past 140 years ... you think I'm wrong for no other reason than the math is over your head ... CCC Alarmists say the exact same thing and you're okay with that ... pathetic ...

Yours is an interesting philosophy ... but without the math then it's not science ... you don't know any physics, and it shows ...

... anomalies like solar minima ...

HAW HAW HAW HAW HAW HAW HAW HAW ... keep posting, I like to be reminded you posted these kinds of gems ...

No matter how much idiocy/demand-detail-fallacy you throw at it, it dos not refute AGW.

The First Law of Thermodynamics is hardly an idiocy ... nor a detail fallacy ... it's the Law ... and if it refutes AGW, then AGW is refuted ... whether pussy-boy "can't-do-long-division-weeny" like yourself agree or not ... if your philosophy doesn't allow you to ever be wrong, then you're alone having faith in that philosophy ...

It's not the warming I deny, nor man's roll in causing that warming ... I'm denying the catastrophic effects of such AGW ... hypercanes and hockey sticks violate the laws of nature ... so do droughts and floods in places where droughts and floods were previously impossible ... the math is plain as day, and 1.8 W/m^2 won't do the catastrophes you say it will ... I know that's non-sense to you, you don't understand the underlying physics that drives weather and climate ... it takes magic to make a desert out of The Ukraine ... something even profuse amounts of Cesium-135 can't do ...

Can't even calculate averages ... of course you want to dismiss them ... "proof-by-graph" is philosophy don't you know ...
 
The First Law of Thermodynamics is hardly an idiocy ... nor a detail fallacy ... it's the Law ... and if it refutes AGW, then AGW is refuted ...
ROTF!
Idiocy is convincing oneself that something that by definition applies only to an "isolated system (for which energy and matter transfer through the system boundary are not possible)" could somehow be used to "refute" AGW where the the prime mover (The Sun) itself so obviously resides outside and thus transfers the driving energy "through the system boundary", not to mention all the other energy being exchanged with space. Your incessant attempts to sound authoritative in this area fall flatter than a cow patty on a globally warmed day. Please never stop :auiqs.jpg:
 

Forum List

Back
Top