no opinion just the facts..... People shot to death by U.S. police, by race 2020 | Statista
Navigation
Install the app
How to install the app on iOS
Follow along with the video below to see how to install our site as a web app on your home screen.

Note: This feature currently requires accessing the site using the built-in Safari browser.
More options
You are using an out of date browser. It may not display this or other websites correctly.
You should upgrade or use an alternative browser.
You should upgrade or use an alternative browser.
police shooting demographics.
- Thread starter yidnar
- Start date
Augustine_
Platinum Member
Trump's statists are all in favor of police shootings
BrokeLoser
Diamond Member
Trump's statists are all in favor of police shootings
So whites are in favor of police shooting mostly whites?
That really makes sense to you?
BrokeLoser
Diamond Member
BINGO....I suspect that there will be certain people that suddenly understand per capita.
Hey IM2 do you still hate per capita factoring?
Fit your current narrative?
Trump's statists are all in favor of police shootings
Where did you get that idea? Show us some proof.

- Mar 11, 2015
- 76,952
- 34,123
- 2,330
BINGO....I suspect that there will be certain people that suddenly understand per capita.
Hey IM2 do you still hate per capita factoring?
Fit your current narrative?
- 27% of U.S. police killings between January 2013 - December 2017 were committed by police departments of the 100 largest U.S. cities.
- Black people were 39% of people killed by these 100 police departments despite being only 21% of the population in their jurisdictions.
- Only 1 of the 100 largest city police departments did not kill anyone from Jan 2013 - Dec 2017 (Irvine, CA).
- 48% of unarmed people killed by the 100 largest city police departments were black. These police departments killed unarmed black people at a rate 4 times higher than unarmed white people.
- Rates of violent crime in cities did not make it any more or less likely for police departments to kill people. For example, Buffalo and Newark police departments had low rates of police violence despite high crime rates while Spokane and Bakersfield had relatively low crime rates and high rates of police violence.
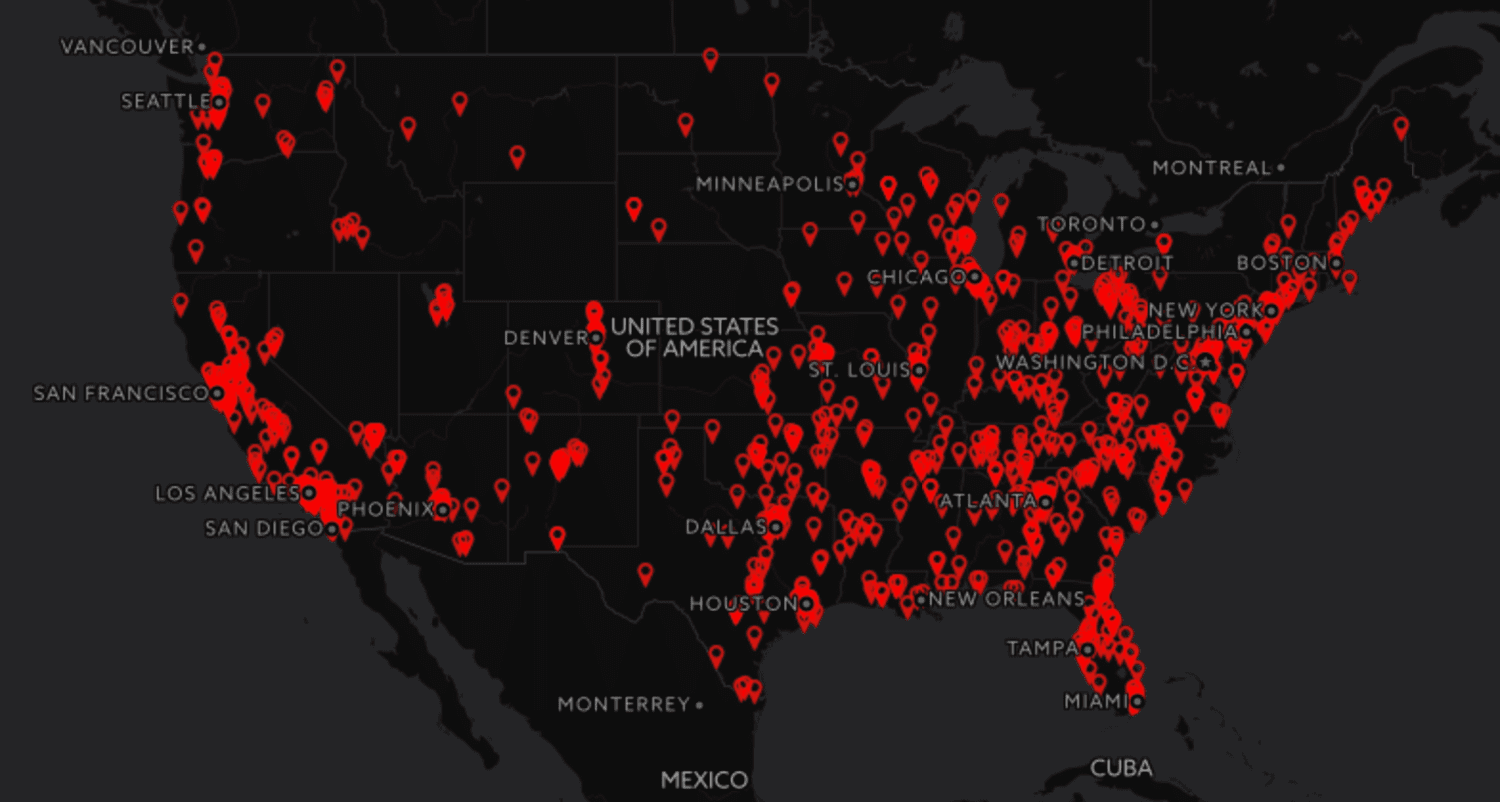
Police Accountability Tool — Mapping Police Violence
Explore data on killings by the 100 largest city police departments.
 mappingpoliceviolence.org
Per capita fits your narrative because you only use it to deny white criminality. Because I can use per capita to show you how whites continue to benefit from racism. So just be quiet or you will get embarrassed.
BrokeLoser
Diamond Member
BINGO....I suspect that there will be certain people that suddenly understand per capita.
Hey IM2 do you still hate per capita factoring?
Fit your current narrative?
- 27% of U.S. police killings between January 2013 - December 2017 were committed by police departments of the 100 largest U.S. cities.
- Black people were 39% of people killed by these 100 police departments despite being only 21% of the population in their jurisdictions.
- Only 1 of the 100 largest city police departments did not kill anyone from Jan 2013 - Dec 2017 (Irvine, CA).
- 48% of unarmed people killed by the 100 largest city police departments were black. These police departments killed unarmed black people at a rate 4 times higher than unarmed white people.
- Rates of violent crime in cities did not make it any more or less likely for police departments to kill people. For example, Buffalo and Newark police departments had low rates of police violence despite high crime rates while Spokane and Bakersfield had relatively low crime rates and high rates of police violence.
Police Accountability Tool — Mapping Police Violence
Explore data on killings by the 100 largest city police departments.
Per capita fits your narrative because you only use it to deny white criminality. Because I can use per capita to show you how whites continue to benefit from racism. So just be quiet or you will get embarrassed.
Major Findings •
The evidence suggests that if there is police racial bias in arrests it is negligible. Victim and witness surveys show that police arrest violent criminals in close proportion to the rates at which criminals of different races commit violent crimes.
• There are dramatic race differences in crime rates. Asians have the lowest rates, followed by whites, and then Hispanics. Blacks have notably high crime rates. This pattern holds true for virtually all crime categories and for virtually all age groups.
• In 2013, a black was six times more likely than a non-black to commit murder, and 12 times more likely to murder someone of another race than to be murdered by someone of another race.
• In 2013, of the approximately 660,000 crimes of interracial violence that involved blacks and whites, blacks were the perpetrators 85 percent of the time. This meant a black person was 27 times more likely to attack a white person than vice versa. A Hispanic was eight times more likely to attack a white person than vice versa.
• In 2014 in New York City, a black was 31 times more likely than a white to be arrested for murder, and a Hispanic was 12.4 times more likely. For the crime of “shooting”—defined as firing a bullet that hits someone—a black was 98.4 times more likely than a white to be arrested, and a Hispanic was 23.6 times more likely.
• If New York City were all white, the murder rate would drop by 91 percent, the robbery rate by 81 percent, and the shootings rate by 97 percent.
• In an all-white Chicago, murder would decline 90 percent, rape by 81 percent, and robbery by 90 percent.
• In 2015, a black person was 2.45 times more likely than a white person to be shot and killed by the police. A Hispanic person was 1.21 times more likely. These figures are well within what would be expected given race differences in crime rates and likelihood to resist arrest.
• In 2015, police killings of blacks accounted for approximately 4 percent of homicides of blacks. Police killings of unarmed blacks accounted for approximately 0.6 percent of homicides of blacks. The overwhelming majority of black homicide victims (93 percent from 1980 to 2008) were killed by blacks.
Similar threads
- Replies
- 13
- Views
- 219
- Replies
- 27
- Views
- 280
- Replies
- 12
- Views
- 204
- Replies
- 22
- Views
- 303
- Replies
- 199
- Views
- 1K
Latest Discussions
- Replies
- 48
- Views
- 201
- Replies
- 283
- Views
- 1K
Forum List
-
-
-
-
-
Political Satire 8040
-
-
-
-
-
-
-
-
-
-
-
-
-
-
-
-
-
-
-
ObamaCare 781
-
-
-
-
-
-
-
-
-
-
-
Member Usernotes 469
-
-
-
-
-
-
-
-
-
-