Ocean Temps, Models vs Reality

IanC

Gold Member
Sep 22, 2009
11,061
1,344
245
figure-1-trend-map-comparison-reynolds-oi-v2.png


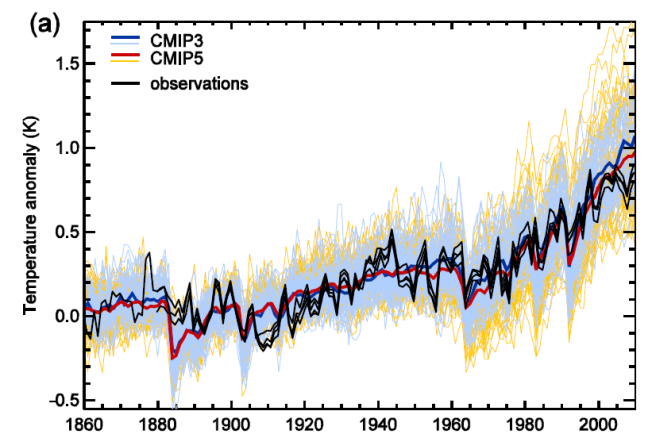
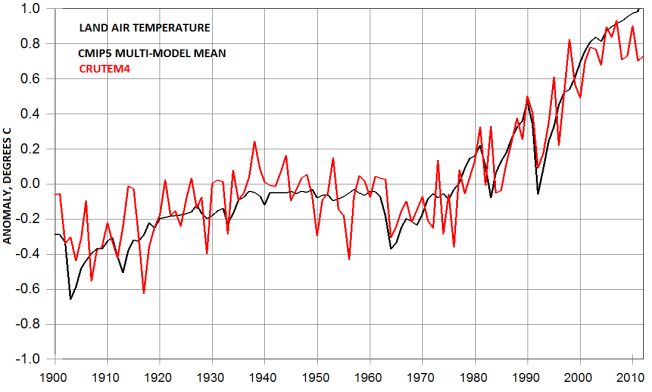
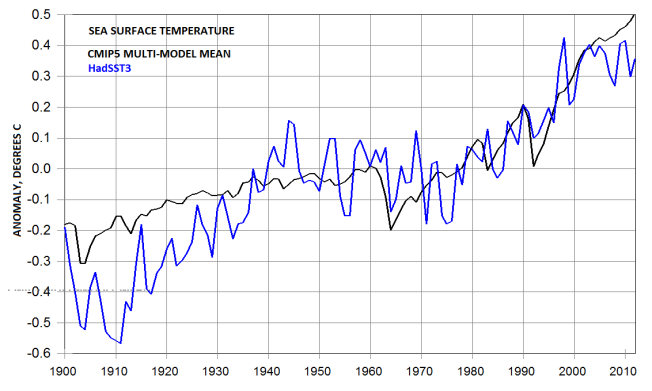
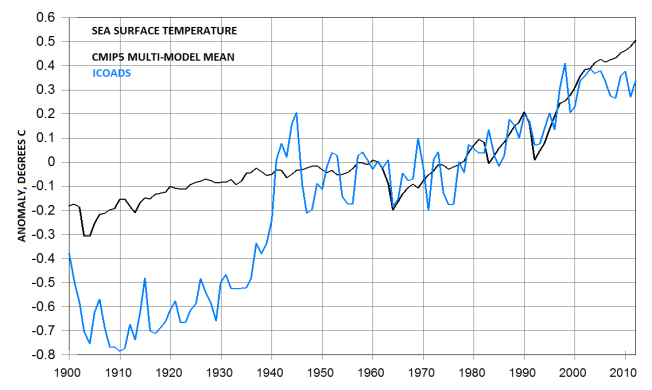
Totally different shape. Keep in mind that the models are already tuned to what happened. The actual forecast is only for the last few years.

Check out the rest at Climate Models Are NOT Simulating Earth’s Climate – Part 1

All data used is freely available in the public domain
 
From what I see the actual temperatures are HIGHER than predicted. It seems to turn the usual criticisms on their head. Are we going to get a rash of posts accusing the NOAA of understating GW?
 
What you got there is 30yrs of data or simulation all boiled down to ONE "mean" value.. That's the kind of oversimplication that gets the warmers in trouble all the time. Just comparing the 30 yr avg will obscure the more meaningful differences between the models and the data.

Only observation from this reduction is that the models are not very spatially SPECIFIC. They tend to smear the actual warming over entire oceans. And I'm surprised -- as to how spatially specific the ACTUAL warming has been. Not truely "global" is it?

The other observation is that the models obviously OVER-EMPHASIZED the recurring El Ninos. Oh -- well...
They only know the tricks they've been taught.. Good dog..
 
From what I see the actual temperatures are HIGHER than predicted. It seems to turn the usual criticisms on their head. Are we going to get a rash of posts accusing the NOAA of understating GW?

Since it's a 30 yr average of performance, the OVERALL warming (integrated over the ocean surface) are PROBABLY closer than this comparison leads folks to believe. It's just that the models distribute that heat over much wider areas.. While the actual data shows the ocean is not really warming "globally" over that 30 years, but it is very much confined to particular regions.
 
From what I see the actual temperatures are HIGHER than predicted. It seems to turn the usual criticisms on their head. Are we going to get a rash of posts accusing the NOAA of understating GW?


???? How do you figure higher warming in some specific spots means more warming than only slightly less warming over all the oceans?

The models totally fail at capturing ENSO and the AMO.
 
The article gives maps of all the major purveyors of SSTs. Just because I reference them that does not mean that I think they are necessarily accurate. The difficulties in developing a SST dataset are myriad, and the error ranges are much higher than advertised. It is not unusual for one version to be outside the error bars of the previous version.
 
From what I see the actual temperatures are HIGHER than predicted. It seems to turn the usual criticisms on their head. Are we going to get a rash of posts accusing the NOAA of understating GW?


???? How do you figure higher warming in some specific spots means more warming than only slightly less warming over all the oceans?

The models totally fail at capturing ENSO and the AMO.
Something about this;
Northern Hemisphere Sea Ice Area


Why are you spamming a thread about models failing to capture SST reality with a graph on ice extent? What's next? An ad hominem attack on the person posting up freely available SST and model data?
 
From what I see the actual temperatures are HIGHER than predicted. It seems to turn the usual criticisms on their head. Are we going to get a rash of posts accusing the NOAA of understating GW?


???? How do you figure higher warming in some specific spots means more warming than only slightly less warming over all the oceans?

The models totally fail at capturing ENSO and the AMO.
Something about this;
Northern Hemisphere Sea Ice Area
and?

Please don't encourage him to deflect from the OP.
I didn't, I wanted to know what it had to do with the OP, so and what, what does it have to do with the subject. I simplified it. It seemed he stopped and didn't finish where he was going and I was interested. Not sure how you feel that was encouragement.
 
AR5-

image1.png


Broken down into land and ocean data-

image2.png


fig3.png


And with SST raw data-

fig4.png


I believe that gives you an idea why the SSTs were adjusted up.
 
No comment from our warmist peanut gallery? The ones who proclaim adjustments raise temps from the goodness of their hearts rather than to salvage some sort of respectability for the climate models?

I am not saying that bucket adjustments aren't necessary. I am saying that it was convenient to their needs and in no way compensates for the endless new adjustments that are being put in place to reduce the embarrassment of The Pause. (Which is still present even with the biggest El Nino since '98)
 
Some people claim that The Pause is cherrypicked. That is incorrect.

The Pause has only one picked date. Today, or in reality, the last month with published data.

I think the latest El Nino may in fact 'break' the Pause. But the next La Nina will reinstate it with an even longer duration.

And the climate models will keep getting further and further out of touch with reality.
 

Forum List

Back
Top