miami_thomas
VIP Member
- Jan 20, 2011
- 1,019
- 86
- 83
I decided to go back and look at the numbers when it comes to the Democrat arguments. Below I have listed the numbers under each president since Woodrow Wilson through president Obama. I listed the revenues, expenditures, surplus/deficits, accumulated debt, and GDP for each year. The first number under each is the amount in billions. The second number is the percent increase from the previous year. The last number in each column is the percent of GDP. I also added a section showing what the numbers would be if the Bush tax cuts had expired at the beginning of president Obamas term.
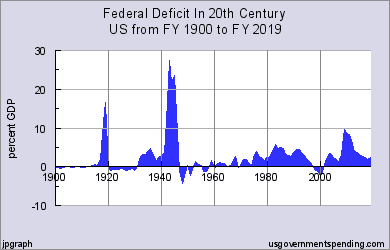
The first thing that sticks out is that we are spending at the highest level since FDR and that was during World War 2. Matter of fact the only presidents to spend as much as Obama are FDR and Woodrow Wilson and both are involved in World Wars. Next you can see that the argument that the issue with deficits is with the Bush tax cuts for the rich does not hold up. The estimate from the CBO is the tax cuts are worth 1 trillion dollars over 10 years. Now I realize the number is smaller in the beginning and bigger in the end but I decide to be generous. I added 100 billion each year which is what 1 trillion over 10 years would be. You can see it does not do much good.
Next thing you notice is that the revenues drop significantly at the beginning of 2008 not 2001 or 2003 when the Bush tax cuts went in. Now the revenues did drop briefly in 2003 and 2004 but rebounded to a normal rate in 2005 under Bush. The normal rate seems to sit around 17 and 19 percent of GDP for revenue. That of course would mean spending should be somewhere just below revenue at around 16 to 18 percent of GDP depending on revenues. But actually it needs to be much lower.
Look at the Clinton years where we actually had a surplus for once and notice the debt continued to climb. Notice that even at a surplus of 236 billion the debt still grew by 23 billion. So I actually had to dig a little to see why but as it turns out it is the interest on the debt we currently held. Interesting that is not counted in expenditures but I digress. This would mean that spending would actually need to be somewhere around 5 percent below revenues just to make ends meet.
Last but not least is the talk about how the tax on the wealthy when FDR was president was 91 percent. Well if you look at the data you can tell that no one was paying a 91 percent rate. You can see by the data that the highest revenues ever got as a percent of GDP was 23% and even that was too high as you can see that we started to go into a recession.
Woodrow Wilson/Democratic
Year Tax Revenue Expenditures Sur/Def Total Debt GDP
1913 $1.0 /11% /2% $1.0 /11% /3% $0.0 -$2.9 /0% /7% $39.1 /5%
1914 $0.9 /-10%/3% $1.0 /0% /3% -$0.1 -$2.9 /0% /8% $36.5 /-7%
1915 $0.8 /-11%/2% $1.1 /10% /3% -$0.2 -$3.1 /7% /8% $38.7 /6%
1916 $0.9 /13% /2% $1.0 /-9% /2% -$0.2 -$3.6 /16% /7% $49.6 /28%
1917 $1.2 /33% /2% $2.3 /130%/4% -$1.1 -$5.7 /58% /10% $59.7 /20%
1918 $4.0 /233%/2% $13.0 /465%/17% -$9.0 -$14.6 /156%/19% $75.8 /27%
1919 $5.7 /43% /5% $18.9 /45% /24% -$13.2 -$27.4 /88% /35% $78.3 /3%
1920 $7.4 /30% /7% $6.8 /-64%/8% +$0.6 -$26.0 /-5% /29% $88.4 /13%
Warren G. Harding/Republican
Year Tax Revenue Expenditures Sur/Def Total Debt GDP
1921 $6.2 /-16%/8% $5.5 /-19%/7% +$0.7 -$24.0 /-8%/33% $73.6 /-17%
1922 $4.3 /-31%/6% $3.8 /-31%/5% +$0.5 -$23.0 /-4%/31% $73.4 /0%
Calvin Coolidge/Republican
Year Tax Revenue Expenditures Sur/Def Total Debt GDP
1923 $4.3 /0% /5% $3.7 /-3% /4% +$0.6 -$22.3 /-3%/26% $85.4 /16%
1924 $4.3 /0% /5% $3.7 /0% /4% +$0.6 -$21.3 /-4%/25% $86.9 /2%
1925 $4.0 /-7% /4% $3.6 /-3% /4% +$0.4 -$20.5 /-4%/23% $90.6 /4%
1926 $4.2 /5% /4% $3.6 /0% /4% +$0.6 -$19.6 /-4%/20% $96.9 /7%
1927 $4.5 /7% /5% $3.5 /-3% /4% +$0.9 -$18.5 /-6%/19% $95.5 /-1%
1928 $4.3 /-4% /4% $3.7 /6% /4% +$0.7 -$17.6 /-5%/18% $97.4 /2%
Herbert Hoover/Republican
Year Tax Revenue Expenditures Sur/Def Total Debt GDP
1929 $4.3 /0% /4% $3.8 /3% /4% +$0.5 -$16.9 /-4%/16% $103.6 /6%
1930 $4.8 /12% /5% $4.0 /5% /4% +$0.9 -$16.2 /-4%/18% $91.2 /-12%
1931 $4.0 /-17%/5% $4.1 /2% /5% -$0.1 -$16.8 /4% /22% $76.5 /-16%
1932 $2.6 /-35%/4% $4.3 /5% /7% -$1.6 -$19.5 /16%/33% $58.7 /-23%
Franklin D. Roosevelt/Democratic
Year Tax Revenue Expenditures Sur/Def Total Debt GDP
1933 $3.3 /27% /6% $5.1 /19% /9% -$1.8 -$22.5 /15%/40% $56.4 /-4%
1934 $3.9 /18% /6% $5.9 /16% /9% -$2.1 -$27.1 /20%/41% $66.0 /17%
1935 $4.5 /15% /6% $7.6 /29% /10% -$3.0 -$28.7 /6% /39% $73.3 /11%
1936 $5.2 /16% /6% $9.2 /21% /11% -$4.0 -$33.8 /18%/40% $83.8 /14%
1937 $6.2 /19% /7% $8.8 /-4% /10% -$2.6 -$36.4 /8% /40% $91.9 /10%
1938 $7.2 /16% /8% $8.4 /-5% /10% -$1.2 -$37.2 /2% /43% $86.1 /-6%
1939 $7.1 /-1% /8% $9.3 /11% /10% -$2.1 -$40.4 /9% /44% $92.2 /7%
1940 $7.0 /-1% /7% $10.1 /9% /10% -$3.1 -$50.7 /25%/50% $101.4 /10%
1941 $9.4 /34% /7% $14.2 /41% /11% -$4.7 -$57.5 /13%/45% $126.7 /25%
1942 $16.1 /71% /10% $35.5 /150%/22% -$19.5 -$79.2 /38%/49% $161.9 /28%
1943 $27.3 /70% /14% $83.0 /134%/42% -$55.7 -$142.6 /80%/72% $198.6 /23%
1944 $51.4 /88% /23% $100.5 /21% /46% -$49.1 -$204.1 /43%/93% $219.8 /11%
Harry S. Truman/Democratic
Year Tax Revenue Expenditures Sur/Def Total Debt GDP
1945 $53.2 /4% /24% $106.9 /6% /48% -$53.7 -$260.1 /27%/117% $223.0 /1%
1946 $46.4 /-13%/21% $66.5 /-38%/30% -$20.1 -$271.0 /4% /122% $222.2 /0%
1947 $44.6 /-4% /18% $41.4 /-38%/17% +$3.2 -$257.1 /-5%/105% $244.1 /10%
1948 $47.3 /6% /18% $35.6 /-14%/13% +$11.7 -$252.0 /-2%/94% $269.1 /10%
1949 $44.2 /-7% /17% $40.2 /13% /15% +$4.0 -$252.6 /0% /95% $267.2 /-1%
1950 $43.5 /-2% /15% $44.8 /11% /15% -$1.3 -$256.9 /2% /87% $293.7 /10%
1951 $56.7 /30% /17% $48.9 /9% /14% +$7.8 -$255.3 /-1%/75% $339.3 /16%
1952 $71.8 /27% /20% $71.6 /46% /20% +$0.2 -$259.1 /1% /72% $358.3 /6%
Dwight D. Eisenhower/Republican
Year Tax Revenue Expenditures Sur/Def Total Debt GDP
1953 $74.2 /3% /20% $80.0 /12% /21% -$5.8 -$266.0 /3% /70% $379.3 /6%
1954 $75.8 /2% /20% $77.7 /-3% /20% -$1.9 -$270.8 /2% /71% $380.4 /0%
1955 $71.9 /-5% /17% $73.4 /-6% /18% -$1.5 -$274.4 /1% /66% $414.7 /9%
1956 $81.3 /13% /19% $76.0 /4% /17% +$5.3 -$272.7 /-1%/62% $437.4 /5%
1957 $87.1 /7% /19% $81.8 /8% /18% +$5.3 -$272.3 /0% /59% $461.1 /5%
1958 $86.0 /-1% /18% $86.1 /5% /18% $0.0 -$279.7 /3% /60% $467.2 /1%
1959 $85.5 /-1% /17% $93.5 /9% /18% -$8.1 -$287.5 /3% /57% $506.6 /8%
1960 $99.8 /17% /19% $97.3 /4% /18% +$2.5 -$290.5 /1% /55% $526.4 /4%
John F. Kennedy/Democratic
Year Tax Revenue Expenditures Sur/Def Total Debt GDP
1961 $101.3 /2% /19% $104.9 /8% /19% -$3.5 -$292.6 /1% /54% $544.8 /3%
1962 $99.7 /-2% /17% $106.8 /2% /18% -$7.1 -$302.9 /4% /52% $585.7 /8%
Lyndon B. Johnson/Democratic
Year Tax Revenue Expenditures Sur/Def Total Debt GDP
1963 $106.6 /7% /17% $111.3 /4% /18% -$4.8 -$310.3 /2% /50% $617.8 /5%
1964 $112.6 /6% /17% $118.5 /6% /18% -$5.9 -$316.1 /2% /48% $663.6 /7%
1965 $116.8 /4% /16% $118.2 /0% /16% -$1.4 -$322.3 /2% /45% $719.1 /8%
1966 $130.8 /12% /17% $134.5 /14% /17% -$3.7 -$328.5 /2% /42% $787.7 /10%
1967 $148.8 /14% /18% $157.5 /17% /19% -$8.6 -$340.4 /4% /41% $832.4 /6%
1968 $153.0 /3% /17% $178.1 /13% /20% -$25.2 -$368.7 /8% /41% $909.8 /9%
Richard Nixon/Republican
Year Tax Revenue Expenditures Sur/Def Total Debt GDP
1969 $186.9 /22% /19% $183.6 /3% /19% +$3.2 -$365.8 /-1%/37% $984.4 /8%
1970 $192.8 /3% /19% $195.6 /7% /19% -$2.8 -$380.9 /4% /37% $1,038.3/5%
1971 $187.1 /-3% /17% $210.2 /7% /19% -$23.0 -$408.2 /7% /36% $1,126.8/9%
1972 $207.3 /11% /17% $230.7 /10% /19% -$23.4 -$435.9 /7% /35% $1,237.9/10%
1973 $230.8 /11% /17% $245.7 /7% /18% -$14.9 -$466.3 /7% /34% $1,382.3/12%
Gerald Ford/Republican
Year Tax Revenue Expenditures Sur/Def Total Debt GDP
1974 $263.2 /14% /18% $269.4 /10% /18% -$6.1 -$483.9 /4% /32% $1,499.5/8%
1975 $279.1 /6% /17% $332.3 /23% /20% -$53.2 -$541.9 /12%/33% $1,637.7/9%
1976 $298.1 /7% /16% $371.8 /12% /20% -$73.7 -$629.0 /16%/34% $1,824.6/11%
Jimmy Carter/Democratic
Year Tax Revenue Expenditures Sur/Def Total Debt GDP
1977 $355.6 /19% /18% $409.2 /10% /20% -$53.7 -$706.4 /12%/35% $2,030.1/11%
1978 $399.6 /12% /17% $458.7 /12% /20% -$59.2 -$776.6 /10%/34% $2,293.8/13%
1979 $463.3 /16% /18% $504.0 /10% /20% -$40.7 -$829.5 /7% /32% $2,562.2/12%
1980 $517.1 /12% /19% $590.9 /17% /21% -$73.8 -$909.0 /10%/33% $2,788.1/9%
Ronald Reagan/Republican
Year Tax Revenue Expenditures Sur/Def Total Debt GDP
1981 $599.3 /16% /19% $678.2 /15% /22% -$79.0 -$994.8 /9% /32% $3,126.8/12%
1982 $617.8 /3% /19% $745.7 /10% /23% -$128.0 -$1,137.3/14%/35% $3,253.2/4%
1983 $600.6 /-3% /17% $808.4 /8% /23% -$207.8 -$1,371.7/21%/39% $3,534.6/9%
1984 $666.4 /11% /17% $851.8 /5% /22% -$185.4 -$1,564.6/14%/40% $3,930.9/11%
1985 $734.0 /10% /17% $946.3 /11% /22% -$212.3 -$1,817.4/16%/43% $4,217.5/7%
1986 $769.2 /5% /17% $990.4 /5% /22% -$221.2 -$2,120.5/17%/48% $4,460.1/6%
1987 $854.3 /11% /18% $1,004.0/1% /21% -$149.7 -$2,346.0/11%/50% $4,736.4/6%
1988 $909.2 /6% /18% $1,064.4/6% /21% -$155.2 -$2,601.1/11%/51% $5,100.4/8%
George H. W. Bush/Republican
Year Tax Revenue Expenditures Sur/Def Total Debt GDP
1989 $991.1 /9% /18% $1,143.7/7% /21% -$152.6 -$2,867.8/10%/52% $5,482.1/7%
1990 $1,032.0/4% /18% $1,253.0/10% /22% -$221.0 -$3,206.3/12%/55% $5,800.5/6%
1991 $1,055.0/2% /18% $1,324.2/6% /22% -$269.2 -$3,598.2/12%/60% $5,992.1/3%
1992 $1,091.2/3% /17% $1,381.5/4% /22% -$290.3 -$4,001.8/11%/63% $6,342.3/6%
Bill Clinton/Democratic
Year Tax Revenue Expenditures Sur/Def Total Debt GDP
1993 $1,154.0/6% /17% $1,409.4/2% /21% -$255.1 -$4,351.0/9% /65% $6,667.4/5%
1994 $1,258.6/9% /18% $1,461.8/4% /21% -$203.2 -$4,643.3/7% /66% $7,085.2/6%
1995 $1,351.8/7% /18% $1,515.8/4% /20% -$164.0 -$4,920.6/6% /66% $7,414.7/5%
1996 $1,453.1/7% /19% $1,560.5/3% /20% -$107.4 -$5,181.5/5% /66% $7,838.5/6%
1997 $1,579.2/9% /19% $1,610.1/3% /19% -$21.9 -$5,369.2/4% /65% $8,270.5/6%
1998 $1,721.7/9% /20% $1,652.5/3% /19% +$69.3 -$5,478.2/2% /63% $8,727.0/6%
1999 $1,827.5/6% /20% $1,701.8/3% /18% +$125.6 -$5,605.5/2% /60% $9,286.9/6%
2000 $2,026.2/11% /20% $1,789.0/5% /18% +$236.2 -$5,628.7/0% /57% $9,884.2/6%
George W. Bush/Republican
Year Tax Revenue Expenditures Sur/Def Total Debt GDP
2001 $1,991.1/-2% /19% $1,862.9/4% /18% +$128.2 -$5,769.9/3% /56% $10,218.0/3%
2002 $1,853.1/-7% /18% $2,010.9/8% /19% -$157.8 -$6,198.4/7% /59% $10,572.4/3%
2003 $1,782.3/-4% /16% $2,159.9/7% /20% -$377.6 -$6,760.0/9% /61% $11,067.8/5%
2004 $1,880.1/5% /16% $2,252.9/4% /19% -$412.7 -$7,354.7/9% /62% $11,788.9/7%
2005 $2,153.6/15% /17% $2,472.0/10% /20% -$318.3 -$7,905.3/7% /63% $12,554.5/6%
2006 $2,406.9/12% /18% $2,655.1/7% /20% -$248.2 -$8,451.4/7% /63% $13,310.9/6%
2007 $2,568.0/7% /18% $2,728.7/3% /20% -$160.7 -$8,950.8/6% /64% $13,969.3/5%
2008 $2,524.0/-2% /18% $2,982.5/9% /21% -$458.6 -$9,986.1/12%/70% $14,270.5/2%
Barack Obama/Democratic
Year Tax Revenue Expenditures Sur/Def Total Debt GDP
2009 $2,105.0/-17%/15% $3,517.7/18% /25% -$1,412.7 -$11,875.9/19%/85% $14,014.8/-2%
2010 $2,162.7/3% /15% $3,456.2/-2% /24% -$1,293.5 -$13,528.8/14%/93% $14,551.8/4%
2011 $2,303.5/7% /15% $3,603.1/4% /24% -$1,299.6 -$14,764.2/9% /99% $14,958.6/3%
2012 $2,468.6/7% /16% $3,795.6/5% /24% -$1,327.0 -$16,350.9/11%/105% $15,601.5/4%
(Est)
Barack Obama/Democratic - If Bush Tax Cuts Had Expired On The Wealthy
Year Tax Revenue Expenditures Sur/Def Total Debt GDP
2009 $2,205.0/-13%/16% $3,517.7/18% /25% -$1,312.7 -$11,775.9/18%/84% $14,014.8/-2%
2010 $2,262.7/3% /16% $3,456.2/-2% /24% -$1,193.5 -$13,328.8/13%/92% $14,551.8/4%
2011 $2,403.5/6% /16% $3,603.1/4% /24% -$1,199.6 -$14,464.2/9% /97% $14,958.6/3%
2012 $2,568.6/7% /16% $3,795.6/5% /24% -$1,227.0 -$15,950.9/10%/102% $15,601.5/4%
(Est)
I gathered my data at http://www.usgovernmentrevenue.com.