Lessons from Past Climate Predictions: IPCC TAR

ScienceRocks

Democrat all the way!
Mar 16, 2010
59,455
6,793
1,900
The Good insane United states of America
Lessons from Past Climate Predictions: IPCC TAR


Lessons from Past Climate Predictions: IPCC TAR
Posted on 10 September 2011 by dana1981

The Intergovernmental Panel on Climate Change (IPCC) Third Assessment Report (TAR) was published in 2001, following the First Assessment Report (FAR) in 1990, and the Second Assessment Report (SAR) in 1995. Chapter 9 of the TAR discusses the report's projections of future climate change.

"A few Atmosphere-Ocean General Circulation Model (AOGCM) simulations include the effects of ozone and/or indirect effects of aerosols (see Table 9.1 for details). Most integrations do not include the less dominant or less well understood forcings such as land-use changes, mineral dust, black carbon, etc. (see Chapter 6). No AOGCM simulations include estimates of future changes in solar forcing or in volcanic aerosol concentrations.

There are many more AOGCM projections of future climate available than was the case for the IPCC Second Assessment Report"

As noted in our analysis of the IPCC SAR, the TAR reduced the projections of aerosol emissions and its associated (negative) radiative forcing in the second half of the 21st Century. As a result, the net radiative forcing in the TAR emissions scenarios were larger than those in the SAR, which led to higher warming projections by 2100. The equilibrium climate sensitivity of climate models also evolved between the SAR's "best estimate" of 2.12°C for doubled CO2 (which we saw led to an underestimate of the observed warming) and TAR:

TARA2projectionsince1990.png


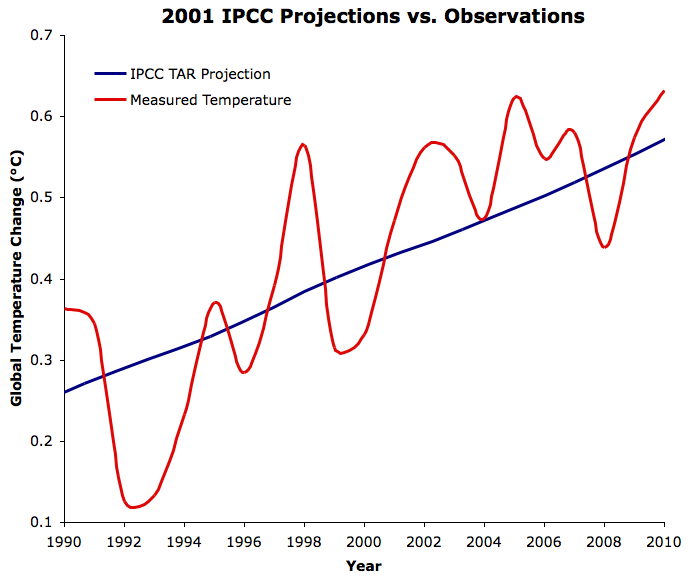
We can also evaluate the accuracy of the IPCC TAR projections by isolating the recent data (Figure 3).

Just for discussion sakes! Is these graphs accurate to IPCC predictions to what really occurred?
 
hmmm.... wouldnt have been better to show both graphs? it seems like the projections were tuned and normalized to give a good result for a specific time range. and use a temp data set exaggerates the increase. but I suppose skeptic sites have done the same in reverse.
 
hey Matt- I googled graph images for IPCC predictions vs temps and it comes up with a lot of graphics and interesting articles. the predictions are better than I thought in some cases but it is odd how a single average line with 2 SD shading looks so much more impressive than a spagetti plot of individual lines that run all over the graph giving just about any result.
 
  • Thread starter
  • Banned
  • #4
hey Matt- I googled graph images for IPCC predictions vs temps and it comes up with a lot of graphics and interesting articles. the predictions are better than I thought in some cases but it is odd how a single average line with 2 SD shading looks so much more impressive than a spagetti plot of individual lines that run all over the graph giving just about any result.

Yeah,

I think this is for the "forcing" on the climate system and the amount of emissions. When they made the third report they were trying to figure out how much the future emissions would be and what the forcing of the gas on the system were. That is pretty much what all those lines are.

This is the one that matches the closes...Read the skeptical science post, and the others and how from the first report they get closer and closer to reality.


"As we have previously discussed, thus far we are on track with the SRES A2 emissions path. Therefore, for the sake of simplifying the evaluation of the IPCC TAR projections, we digitized the results from the simple model tuned to seven AOCGMs using the A2 scenario (the yellow line in Figure 1). Figure 2 shows the comparison between this projection and the observed average global temperature from GISTEMP."


One problem, I read last night within hansen forcing report put out 3 weeks ago is the aerosols appear to be close to be -1.6 watts meter^2 on the climate system...He says with a error of .3+- range. So there is negative forcing on the system....We will see.

Also the solar minimum is having some negative forcing.

It is a complex system. This is what they believe...Others will believe it is completely the sun as they believe that co2 goes against the laws of physics. Me, I'm reporting what they're saying for honest debate...


Yes, they must explain why it goes against the second law, but these predictions are pretty good. Maybe there is away? If you can base a prediction on something then it must have something to it....

We will know one way or another by 2020....

Here is the link for the energy balance paper
http://www.columbia.edu/~jeh1/mailings/2011/20110826_EnergyImbalancePaper.pdf


"Abstract. Improving observations of ocean heat content show that Earth is absorbing more energy from the sun than it is radiating to space as heat, even during the recent solar minimum. The inferred planetary energy imbalance, 0.59 ± 0.15 W/m2 during the 6-year period 2005-2010, confirms the dominant role of the human-made greenhouse effect in driving global climate change. Observed surface temperature change and ocean heat gain together constrain the net climate forcing and ocean mixing rates. We conclude that most climate models mix heat too efficiently into the deep ocean and as a result underestimate the negative forcing by human-made aerosols. Aerosol climate forcing today is inferred to be ‒1.6 ± 0.3 W/m2, implying substantial aerosol indirect climate forcing via cloud changes. Continued failure to quantify the specific origins of this large forcing is untenable, as knowledge of changing aerosol effects is needed to understand future climate change. We conclude that recent slowdown of ocean heat uptake was caused by a delayed rebound effect from Mount Pinatubo aerosols and a deep prolonged solar minimum. Observed sea level rise during the Argo float era is readily accounted for by ice melt and ocean thermal expansion, but the ascendency of ice melt leads us to anticipate acceleration of the rate of sea level rise this decade."

"Knutti (2008) suggests that the explanation might be provided by the fact that most of the models employ a (negative) aerosol forcing that is smaller in magnitude than the aerosol forcing estimated a priori by IPCC. Indeed, most IPCC climate models exclude indirect aerosol forcing, i.e., the effect of human-made aerosols on clouds. IPCC estimates the 2005 aerosol cloud albedo effect as -0.7 W/m2, uncertain by about a factor of two. IPCC also suggests the likelihood of a comparable, but unquantified, negative forcing due to aerosol effects on cloud cover.
If understated aerosol forcing is the correct explanation, producing a too-large net forcing that compensates for ocean models that mix heat too efficiently, there are important implications. The IPCC GHG forcing is about 3 W/m2 in 2005 (2.66 W/m2 from long-lived GHGs and 0.35 W/m2 from tropospheric O3. The typical aerosol forcing in the climate models is about -1 W/m2, leaving a net forcing of about 2 W/m2.
If the negative aerosol forcing is understated by as much as 0.7 W/m2, it means that aerosols have been counteracting half or more of the GHG forcing. In that event, humanity has made itself a Faustian bargain more dangerous than commonly supposed."

Well, the two big things about this is the negative forcing could be far bigger than the ippc 1 watt per meter^2...Also the sun within the solar minimum is having quite a strong effect.
 
Last edited:

Forum List

Back
Top