Olde Europe
Diamond Member
- Dec 8, 2014
- 6,025
- 4,523
- 2,065
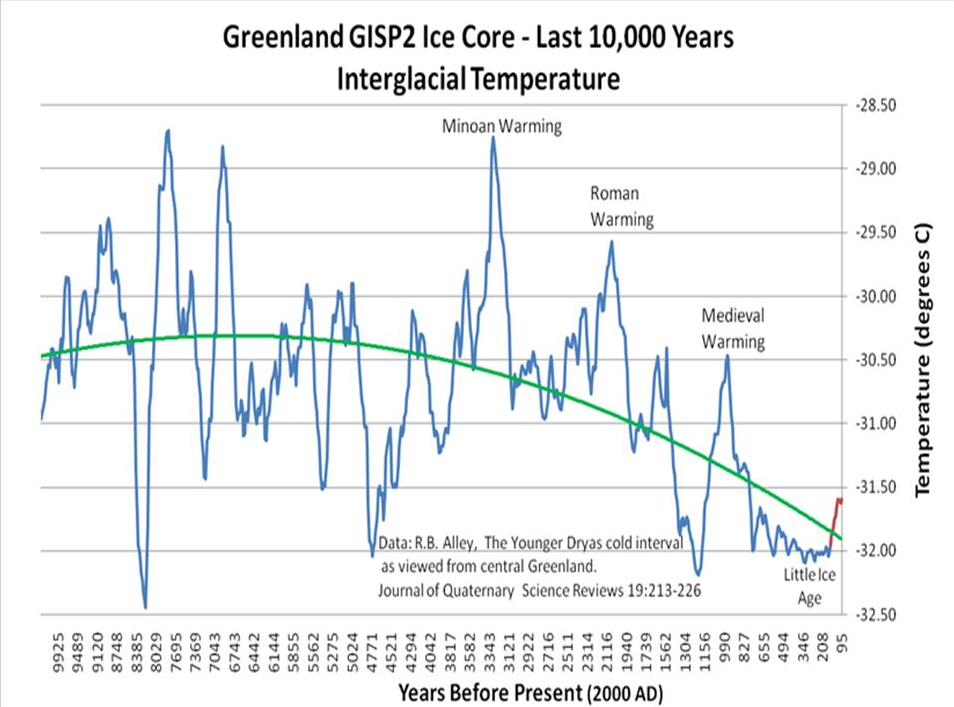
If you look at isotope studies INDIVIDUALLY, for ONE type of proxy and ONE place on the Globe, you WILL get higher resolutions. And those higher LOCAL studies as I've shown you 11 times WILL have MAYBE a hundred year resolution, but not with FULL PEAK values.
Yep. We patiently wait for you to understand that a single place's climate variability may not that accurately reflect the Earth's climate, and therefore your whole argument rests, as usual, on a severe misunderstanding of climate science. But yeah, you've also introduced us to the brilliant idea that a warming spike comparable to one of the last 80 years might have been brought about by an explosion of methane production by termites, with a subsequent collapse in termite populations, without a trace, and without an established cause for either.
We also wait for you to understand that there is no way towards a warming of 1+°C that would come and go without a trace during the last 10k years. Your months-long hyperventilating about the hockey stick notwithstanding, you haven't come up with any.
There are folks actually interested in climate science - Old Rocks being foremost amongst them on these boards - and there are others more interested in muddying the waters, and obstructing debate, and poisoning the wells of knowledge with references to the lying likes of WUWT (etc.). It's quite easy to identify them by their contempt for truth, and by their lying about the stance of others, like,
... your "apocalyptic faith" that the planet will literally DESTROY itself over a 2degC "trigger temperature".
"Literally".


 Shows how little of the 300 pages or more I've put into this forum on the topic. You really should DISCUSS rather than getting personal and attempting to intimadate or maim me.