"There are lies, damn lies, and statistics."
This brilliant quip is attributed to Benjamin Disraeli.
It is illustrative of the fact that bogus and/or misread statistics are used by the Left to persuade the populace that they are being cheated, their income stagnated, through no faults of their own, while the 'rich get richer."
Sadly....the ploy is eminently successful with the 'less than informed.'
1. The current version of the ploy is 'income inequality.'
It is as much a lie as most of the other gambits and fabrications the Left uses to mislead, and to accrue power.
The basic lie is "you should be doing a lot better...you're being cheated by the greedy 1%....we are the only ones that care about you!"
a. First of all...there is no perennial group in America known as the "1%." It is merely a snapshot of the economy at the moment: economic mobility constantly moves folks in and out of said group, and every other economic quintile.
Of individuals who were in the lowest income quintile in 1975, 5.1 percent were still there in 1991, 14.6 percent had moved up to the second quintile, 21 percent to the middle quintile, 30.3 percent to the fourth quintile and 29 percent to the highest quintile. Of those in the highest quintile in 1975, 62.5 percent were still there in 1991, while 0.9 percent had fallen all the way to the bottom fifth. http://www.dallasfed.org/fed/annual/1999p/ar95.pdf
b. And...to disabuse oneself of any idea that the Left cares about anyone....simply look at the party that has led the 10 worst performing cities for half a century, and the truth is staring you in the face.
. DEMOCRAT LEADERSHIP!
Detroit, MI (1st on the poverty rate list) hasnt elected
a Republican mayor since 1961;
Buffalo, NY (2nd) hasnt elected one since 1954;
Cincinnati, OH (3rd) since 1984;
Cleveland, OH (4th) since 1989;
Miami, FL (5th) has never had a Republican Mayor;
St. Louis, MO (6th) . since 1949;
El Paso, TX (7th) has never had a Republican Mayor;
Milwaukee, WI (8th) since 1908;
Philadelphia, PA (9th) since 1952;
Newark, NJ (10th) since 1907.
Top 10 Poorest Cities run by Democrats « Scattershooting
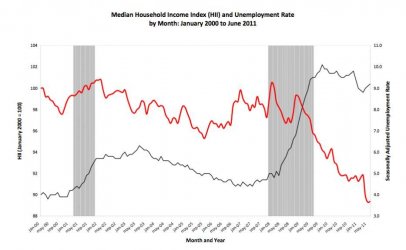
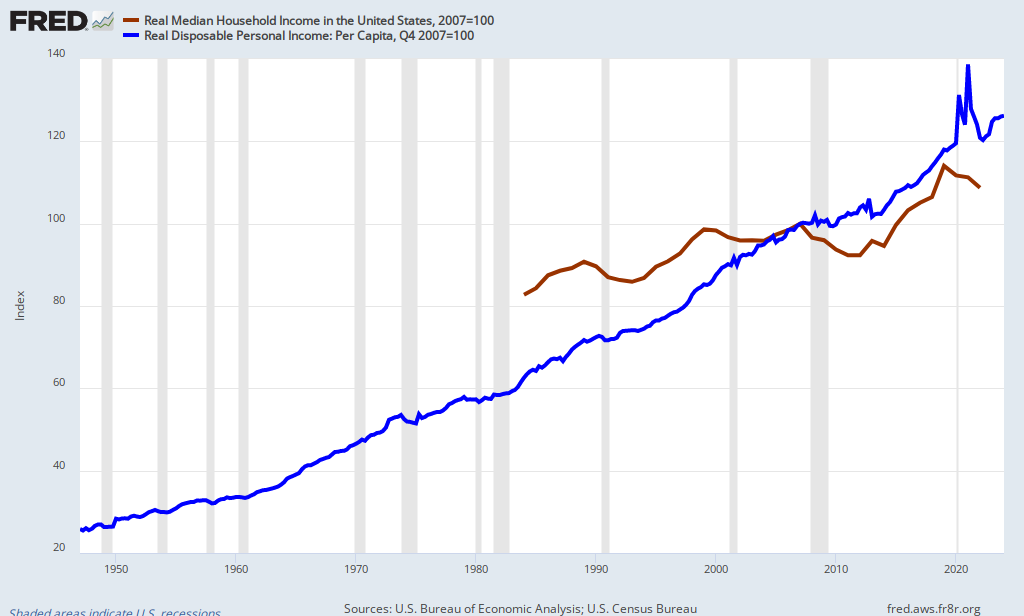
2. Now, how about 'economic stagnation'...the idea that there has been little or no growth in the wealth of the average citizen.
a. In the 25 years from 1980 to 2004, a period during which U.S. gross domestic product per person grew by almost two-thirds, the wages of the typical worker actually fell slightly after accounting for inflation.
http://www.washingtonpost.com/wpdyn/content/article/2006/03/11/AR2006031101051.html
b. Here is where that Disraeli quote comes in. The statistics that claim the above fail to include the value of benefits such as health insurance and retirement benefits, etc., which have represented a growing share of compensation over the years.
See Cox and Alm, The Myths of Rich and Poor, p.21
c. The w2 is not what you get in compensation.....the benefits represent about 30% in addition to salary.
If 30% Of Pay Is Benefits, What About Independent Contractors? - Forbes
d. And....the hidden increases:
The stock market boom of the 90s caused IRA and 401(k) plans to triple: http://federalreserve.gov/releases/z1/Current/annuals/a1995-2004.pdf
Yet while the largest part of the gain went to the bottom 99% of income earners, none was reported on income tax returns, and therefore none of it showed up in income distribution studies based on income tax return data.
But the greatest part of the capital gains of the rich were outside such accounts and thus were reported on returns. This exaggerated and misidentified changes in income distribution.
Capital gains tax rate cuts in 97 and in 2003 caused a surge in reportable capital gains realizations outside of tax-protected retirement accounts. The sharp cut in the rate on dividends in 2003 caused a similar surge in dividends paid and reported. These changes caused distortions in comparing trends in incomes for top income earners versus others.
e. Nor do these sophists separated full time workers from part time (part time work has been growing, another indicator of rising prosperity). Of course, including the weekly wages of part timers pulls down the statistical average.
So...am I disputing that incomes have 'stagnated'?
You betcha.'
This brilliant quip is attributed to Benjamin Disraeli.
It is illustrative of the fact that bogus and/or misread statistics are used by the Left to persuade the populace that they are being cheated, their income stagnated, through no faults of their own, while the 'rich get richer."
Sadly....the ploy is eminently successful with the 'less than informed.'
1. The current version of the ploy is 'income inequality.'
It is as much a lie as most of the other gambits and fabrications the Left uses to mislead, and to accrue power.
The basic lie is "you should be doing a lot better...you're being cheated by the greedy 1%....we are the only ones that care about you!"
a. First of all...there is no perennial group in America known as the "1%." It is merely a snapshot of the economy at the moment: economic mobility constantly moves folks in and out of said group, and every other economic quintile.
Of individuals who were in the lowest income quintile in 1975, 5.1 percent were still there in 1991, 14.6 percent had moved up to the second quintile, 21 percent to the middle quintile, 30.3 percent to the fourth quintile and 29 percent to the highest quintile. Of those in the highest quintile in 1975, 62.5 percent were still there in 1991, while 0.9 percent had fallen all the way to the bottom fifth. http://www.dallasfed.org/fed/annual/1999p/ar95.pdf
b. And...to disabuse oneself of any idea that the Left cares about anyone....simply look at the party that has led the 10 worst performing cities for half a century, and the truth is staring you in the face.
. DEMOCRAT LEADERSHIP!
Detroit, MI (1st on the poverty rate list) hasnt elected
a Republican mayor since 1961;
Buffalo, NY (2nd) hasnt elected one since 1954;
Cincinnati, OH (3rd) since 1984;
Cleveland, OH (4th) since 1989;
Miami, FL (5th) has never had a Republican Mayor;
St. Louis, MO (6th) . since 1949;
El Paso, TX (7th) has never had a Republican Mayor;
Milwaukee, WI (8th) since 1908;
Philadelphia, PA (9th) since 1952;
Newark, NJ (10th) since 1907.
Top 10 Poorest Cities run by Democrats « Scattershooting
2. Now, how about 'economic stagnation'...the idea that there has been little or no growth in the wealth of the average citizen.
a. In the 25 years from 1980 to 2004, a period during which U.S. gross domestic product per person grew by almost two-thirds, the wages of the typical worker actually fell slightly after accounting for inflation.
http://www.washingtonpost.com/wpdyn/content/article/2006/03/11/AR2006031101051.html
b. Here is where that Disraeli quote comes in. The statistics that claim the above fail to include the value of benefits such as health insurance and retirement benefits, etc., which have represented a growing share of compensation over the years.
See Cox and Alm, The Myths of Rich and Poor, p.21
c. The w2 is not what you get in compensation.....the benefits represent about 30% in addition to salary.
If 30% Of Pay Is Benefits, What About Independent Contractors? - Forbes
d. And....the hidden increases:
The stock market boom of the 90s caused IRA and 401(k) plans to triple: http://federalreserve.gov/releases/z1/Current/annuals/a1995-2004.pdf
Yet while the largest part of the gain went to the bottom 99% of income earners, none was reported on income tax returns, and therefore none of it showed up in income distribution studies based on income tax return data.
But the greatest part of the capital gains of the rich were outside such accounts and thus were reported on returns. This exaggerated and misidentified changes in income distribution.
Capital gains tax rate cuts in 97 and in 2003 caused a surge in reportable capital gains realizations outside of tax-protected retirement accounts. The sharp cut in the rate on dividends in 2003 caused a similar surge in dividends paid and reported. These changes caused distortions in comparing trends in incomes for top income earners versus others.
e. Nor do these sophists separated full time workers from part time (part time work has been growing, another indicator of rising prosperity). Of course, including the weekly wages of part timers pulls down the statistical average.
So...am I disputing that incomes have 'stagnated'?
You betcha.'