Global Warming: the Relentless Trend

I'll add that to the already huge list of things you have no idea about.
That's deep, Toddster.

Yes, so was the proof of 97% consensus, using only 77 scientists.
Red herring. There have been many studies using different methods, and all arrive at the fact that there is an overwhelming consensus.

But carry on....it will keep you busy and out of the way....

I find it amusing that YOU are making thumper statement out of ignorance.

Care to show what the IPCC per decade warming rate is?

Consensus is a fallacy, useful in politics worthless in science research which lives on reproducible research.
Listen up crybaby:

Just make your point. Then, please point us to your published scientific articles.

Thank you.

How many published articles presenting the consensus view on all manner of scientific topics would you like to see that turned out to be completely wrong? The fact is that damned near every consensus view on any scientific topic you care to name has been wrong at some point along our search for knowledge. What, exactly makes you think that the anthropogenic global warming hypothesis is the exception and came forth completely right with no need for further examination?
 
Are you actually suggesting that the wisest course would be to assume that every strong scientific consensus is wrong?

You are SO fucking stupid.
 
Are you actually suggesting that the wisest course would be to assume that every strong scientific consensus is wrong?

You are SO fucking stupid.

Consensus is not a scientific word. There's not one time in the Scientific Method that "Consensus" comes into play. It's Moonbat Cultists that tell us their "science" is real -- cuz -- CONSENSUS!!
 
Are you actually suggesting that the wisest course would be to assume that every strong scientific consensus is wrong?

You are SO fucking stupid.

In the early stages of any science, yes...betting against the consensus is the smart bet....

But just to prove my point, and demonstrate exactly how valuable the consensus is at this point in time, lets see a single piece of observed, measured data from the consensus that supports the AGW hypothesis over natural variability. Just one....
 
The same scientists that said in front of Congress that tobacco is harmless,

Link?
Here you go, you lazy little shit :D:

Tobacco and Oil Industries Used Same Researchers to Sway Public

Scientists from the 1950s said smoking was harmless....and these scientists are still around today disputing AGW?

Thanks for the link. I didn't see any claim there that tobacco is harmless.

Those are some long lived scientists! I didn't see any names of these scientists that were testifying lately........

Maybe Old Rocks was wrong? Maybe he has a better link?
"Testifying lately"

Ah yes, the little sidestep. Okay, toddster, let's be clear: you are demanding names of peolle who both lied about climate and tobacco.....LATELY. Right? Of course, "lately" will change, as necessary....

Can we just agree that the same "merchants of doubt" facilitated and supported these campaigns? Actually, I think there's a book about it....;)

"Testifying lately"
Ah yes, the little sidestep


All the Scientific Societies, all the Academies of Science, all the major Universities in the world have policy statements that AGW is real, and a clear and present danger. That is a damned powerful scientific consensus. Against that, we have a couple of scientists stating that is not the case. The same scientists that said in front of Congress that tobacco is harmless, after the tobacco companies enlarged their bank accounts.

Old Rocks was talking about things that were supposedly said in the 1950s or 1960s?
Get the fuck out of here!!

That would be dishonest......or at least stupid.

you are demanding names of peolle who both lied about climate and tobacco.....LATELY. Right?

Only based on Old Rocks' moronic claim.
If you're saying no such testimony happened in the last 30 years,
I'll take your word that Old Rocks was full of shit, to be kind.
About fucking dumb, aren't you. Some of these nations did not exist in the 50's and 60's.

List of Worldwide Scientific Organizations
The following are scientific organizations that hold the position that Climate Change has been caused by human action:

  1. Academia Chilena de Ciencias, Chile
  2. Academia das Ciencias de Lisboa, Portugal
  3. Academia de Ciencias de la República Dominicana
  4. Academia de Ciencias Físicas, Matemáticas y Naturales de Venezuela
  5. Academia de Ciencias Medicas, Fisicas y Naturales de Guatemala
  6. Academia Mexicana de Ciencias,Mexico
  7. Academia Nacional de Ciencias de Bolivia
  8. Academia Nacional de Ciencias del Peru
  9. Académie des Sciences et Techniques du Sénégal
  10. Académie des Sciences, France
  11. Academies of Arts, Humanities and Sciences of Canada
  12. Academy of Athens
  13. Academy of Science of Mozambique
  14. Academy of Science of South Africa
  15. Academy of Sciences for the Developing World (TWAS)
  16. Academy of Sciences Malaysia
  17. Academy of Sciences of Moldova
  18. Academy of Sciences of the Czech Republic
  19. Academy of Sciences of the Islamic Republic of Iran
  20. Academy of Scientific Research and Technology, Egypt
  21. Academy of the Royal Society of New Zealand
  22. Accademia Nazionale dei Lincei, Italy
  23. Africa Centre for Climate and Earth Systems Science
  24. African Academy of Sciences
  25. Albanian Academy of Sciences
  26. Amazon Environmental Research Institute
  27. American Academy of Pediatrics
  28. American Anthropological Association
  29. American Association for the Advancement of Science
  30. American Association of State Climatologists (AASC)
  31. American Association of Wildlife Veterinarians
  32. American Astronomical Society
  33. American Chemical Society
  34. American College of Preventive Medicine
  35. American Fisheries Society
  36. American Geophysical Union
  37. American Institute of Biological Sciences
  38. American Institute of Physics
  39. American Meteorological Society
  40. American Physical Society
  41. American Public Health Association
  42. American Quaternary Association
  43. American Society for Microbiology
  44. American Society of Agronomy
  45. American Society of Civil Engineers
  46. American Society of Plant Biologists
  47. American Statistical Association
  48. Association of Ecosystem Research Centers
  49. Australian Academy of Science
  50. Australian Bureau of Meteorology
  51. Australian Coral Reef Society
  52. Australian Institute of Marine Science
  53. Australian Institute of Physics
  54. Australian Marine Sciences Association
  55. Australian Medical Association
  56. Australian Meteorological and Oceanographic Society
  57. Bangladesh Academy of Sciences
  58. Botanical Society of America
  59. Brazilian Academy of Sciences
  60. British Antarctic Survey
  61. Bulgarian Academy of Sciences
  62. California Academy of Sciences
  63. Cameroon Academy of Sciences
  64. Canadian Association of Physicists
  65. Canadian Foundation for Climate and Atmospheric Sciences
  66. Canadian Geophysical Union
  67. Canadian Meteorological and Oceanographic Society
  68. Canadian Society of Soil Science
  69. Canadian Society of Zoologists
  70. Caribbean Academy of Sciences views
  71. Center for International Forestry Research
  72. Chinese Academy of Sciences
  73. Colombian Academy of Exact, Physical and Natural Sciences
  74. Commonwealth Scientific and Industrial Research Organization (CSIRO) (Australia)
  75. Consultative Group on International Agricultural Research
  76. Croatian Academy of Arts and Sciences
  77. Crop Science Society of America
  78. Cuban Academy of Sciences
  79. Delegation of the Finnish Academies of Science and Letters
  80. Ecological Society of America
  81. Ecological Society of Australia
  82. Environmental Protection Agency
  83. European Academy of Sciences and Arts
  84. European Federation of Geologists
  85. European Geosciences Union
  86. European Physical Society
  87. European Science Foundation
  88. Federation of American Scientists
  89. French Academy of Sciences
  90. Geological Society of America
  91. Geological Society of Australia
  92. Geological Society of London
  93. Georgian Academy of Sciences
  94. German Academy of Natural Scientists Leopoldina
  95. Ghana Academy of Arts and Sciences
  96. Indian National Science Academy
  97. Indonesian Academy of Sciences
  98. Institute of Ecology and Environmental Management
  99. Institute of Marine Engineering, Science and Technology
  100. Institute of Professional Engineers New Zealand
  101. Institution of Mechanical Engineers, UK
  102. InterAcademy Council
  103. International Alliance of Research Universities
  104. International Arctic Science Committee
  105. International Association for Great Lakes Research
  106. International Council for Science
  107. International Council of Academies of Engineering and Technological Sciences
  108. International Research Institute for Climate and Society
  109. International Union for Quaternary Research
  110. International Union of Geodesy and Geophysics
  111. International Union of Pure and Applied Physics
  112. Islamic World Academy of Sciences
  113. Israel Academy of Sciences and Humanities
  114. Kenya National Academy of Sciences
  115. Korean Academy of Science and Technology
  116. Kosovo Academy of Sciences and Arts
  117. l'Académie des Sciences et Techniques du Sénégal
  118. Latin American Academy of Sciences
  119. Latvian Academy of Sciences
  120. Lithuanian Academy of Sciences
  121. Madagascar National Academy of Arts, Letters, and Sciences
  122. Mauritius Academy of Science and Technology
  123. Montenegrin Academy of Sciences and Arts
  124. National Academy of Exact, Physical and Natural Sciences, Argentina
  125. National Academy of Sciences of Armenia
  126. National Academy of Sciences of the Kyrgyz Republic
  127. National Academy of Sciences, Sri Lanka
  128. National Academy of Sciences, United States of America
  129. National Aeronautics and Space Administration
  130. National Association of Geoscience Teachers
  131. National Association of State Foresters
  132. National Center for Atmospheric Research
  133. National Council of Engineers Australia
  134. National Institute of Water & Atmospheric Research, New Zealand
  135. National Oceanic and Atmospheric Administration
  136. National Research Council
  137. National Science Foundation
  138. Natural England
  139. Natural Environment Research Council, UK
  140. Natural Science Collections Alliance
  141. Network of African Science Academies
  142. New York Academy of Sciences
  143. Nicaraguan Academy of Sciences
  144. Nigerian Academy of Sciences
  145. Norwegian Academy of Sciences and Letters
  146. Oklahoma Climatological Survey
  147. Organization of Biological Field Stations
  148. Pakistan Academy of Sciences
  149. Palestine Academy for Science and Technology
  150. Pew Center on Global Climate Change
  151. Polish Academy of Sciences
  152. Romanian Academy
  153. Royal Academies for Science and the Arts of Belgium
  154. Royal Academy of Exact, Physical and Natural Sciences of Spain
  155. Royal Astronomical Society, UK
  156. Royal Danish Academy of Sciences and Letters
  157. Royal Irish Academy
  158. Royal Meteorological Society (UK)
  159. Royal Netherlands Academy of Arts and Sciences
  160. Royal Netherlands Institute for Sea Research
  161. Royal Scientific Society of Jordan
  162. Royal Society of Canada
  163. Royal Society of Chemistry, UK
  164. Royal Society of the United Kingdom
  165. Royal Swedish Academy of Sciences
  166. Russian Academy of Sciences
  167. Science and Technology, Australia
  168. Science Council of Japan
  169. Scientific Committee on Antarctic Research
  170. Scientific Committee on Solar-Terrestrial Physics
  171. Scripps Institution of Oceanography
  172. Serbian Academy of Sciences and Arts
  173. Slovak Academy of Sciences
  174. Slovenian Academy of Sciences and Arts
  175. Society for Ecological Restoration International
  176. Society for Industrial and Applied Mathematics
  177. Society of American Foresters
  178. Society of Biology (UK)
  179. Society of Systematic Biologists
  180. Soil Science Society of America
  181. Sudan Academy of Sciences
  182. Sudanese National Academy of Science
  183. Tanzania Academy of Sciences
  184. The Wildlife Society (international)
  185. Turkish Academy of Sciences
  186. Uganda National Academy of Sciences
  187. Union of German Academies of Sciences and Humanities
  188. United Nations Intergovernmental Panel on Climate Change
  189. University Corporation for Atmospheric Research
  190. Woods Hole Oceanographic Institution
  191. Woods Hole Research Center
  192. World Association of Zoos and Aquariums
  193. World Federation of Public Health Associations
  194. World Forestry Congress
  195. World Health Organization
  196. World Meteorological Organization
  197. Zambia Academy of Sciences
List of Worldwide Scientific Organizations - Office of Planning and Research

Consensus positions has been wrong many times in the past, your reliance on it today shows your ignorance on what drives science research.
 
SSDD in several threads has asked this similar question that NEVER gets answered:

"But just to prove my point, and demonstrate exactly how valuable the consensus is at this point in time, lets see a single piece of observed, measured data from the consensus that supports the AGW hypothesis over natural variability. Just one.... "

Snicker..........................
 
Are you actually suggesting that the wisest course would be to assume that every strong scientific consensus is wrong?

You are SO fucking stupid.

In the early stages of any science, yes...betting against the consensus is the smart bet....

But just to prove my point, and demonstrate exactly how valuable the consensus is at this point in time, lets see a single piece of observed, measured data from the consensus that supports the AGW hypothesis over natural variability. Just one....

Here are thousands you ignorant fool: www.ipcc.ch

Since you indicate that you will accept what they posted in PREVIOUS reports, how about addressing this one that has been ignored repeatedly here in the forum?

From 2001 IPCC report
"For the next two decades, a warming of about 0.2°C per decade is projected for a range of SRES emission scenarios. Even if the concentrations of all greenhouse gases and aerosols had been kept constant at year 2000 levels, a further warming of about 0.1°C per decade would be expected."

This a MINIMUM of .30C per decade based on then emission scenarios, which are now shown to be low thus an even higher warming rate should be considered.

But reality sneaks in:
UAH 1990.png

Stop fighting it.
 
Global Warming: the Relentless Trend
Posted on January 31, 2018 | 5 Comments
When it comes to global warming, recent years have been so hot that it worries even those who deny the problem exists.

No one more desperately needs global warming to end than those most against doing anything about it. That’s why they cling so tight to the notion of a “pause” in global warming, a “pause” that was never more than a false impression, hoping others would believe the myth that it had all somehow stopped. Its death by thermometer has hit them hard.


Yet they can look forward to new pauses to come. The year 2016 was so hot it shattered the previous record by a country mile, boosted as it was by the temperature spike which always follows a powerful el Niño. That leap upward, the hot flash Earth feels after el Niño strikes, when combined with the steady upward climbing that is global warming, yielded a powerful new peak, a highest high born of the unholy marriage of extreme fluctuation and relentless trend. It may become their new delight, this highest peak, a cherry more ripe and juicy than any before it.

And cherry-pick they will. That’s what happened after the 1998 el Niño. Way back in 2006 Bob Carter announced “There is a problem with global warming… it stopped in 1998.” It was bullshit then, it’s bullshit now, but climate deniers have made the most out of what they do best: bullshit. Bob Carter made the most of the biggest confusion about global warming, because most people don’t fully understand what global warming is. It has nothing to do with the perpetual fluctuations.

Global warming is the relentless trend.

The new cherry is so very cherry, a set-up for a whole new “pause” whether it exists or not. Just be sure to start with the big spike near the beginning; when you put such an outburst so early it’s too easy to get, and to give, the wrong idea about the trend. That’s why James Hansen and others have pointed out in a recent report that upcoming temperature data could give just such a false impression.


Therefore, because of the combination of the strong 2016 El Niño and the phase of the solar cycle, it is plausible, if not likely, that the next 10 years of global temperature change will leave an impression of a ‘global warming hiatus’.


We have been warned.

And it has already begun. The pause is coming! Witness Larry Kummer suggest that a new pause may have started already, a “pause perhaps lasting 10 or 15 years,” complete with funny picture to suggest that the “pause that never was,” was. Contrary to the impression one might get from Kummer’s piece, Hansen et al. didn’t suggest that a “pause” or “hiatus” may be on the way, they say that the impression may be. The distinction is at the very heart of the matter.

Just how likely is it then, that recent hot years can create such a false impression? Let’s suppose — just for the sake of argument, mind you — that global warming didn’t pause and isn’t going to. Rather it has been rising at a steady pace while fluctuating up and down randomly, and will continue to do so. Given that there’s no “pause” past or present, just random fluctuation and relentless trend, what might the future bring, and might it give the “impression of a global warming hiatus”?

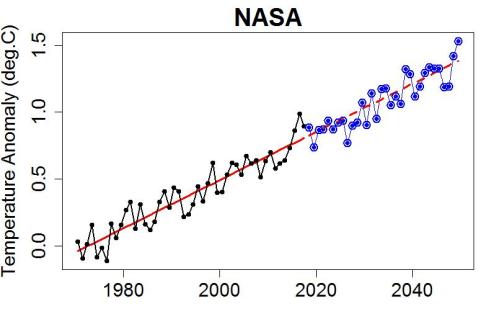
It’s easy to simulate what might happen. Start with global temperature data (from NASA), yearly averages since 1970. Estimate the trend mathematically (least squares regression). Extend that trend line into the future, say, until 2050. That’s what the relentless trend will do, just keep on keepin’ on.

The first thing we note is that the trend alone doesn’t surpass the record high of 2016 until the year 2027. If the data from now on follow the same relentless trend with no noise, then from 2016 through 2026 we’ll have 11 years without breaking the 2016 record. How long will it take for climate deniers to declare a “pause”?

But we have no fluctuations to make the simulation realistic. So, use a random number generator to add simulated “noise” to the trend extension. Here’s one (the first one I got):


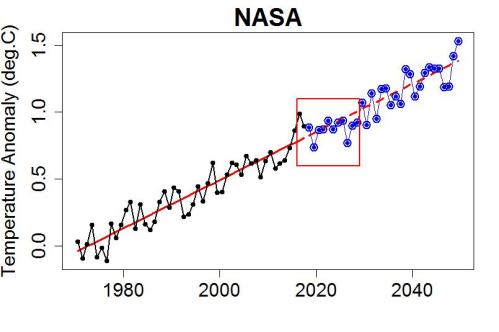
Could this give the “impression of a global warming hiatus”?

How about the 14-year period from 2016 through 2029?


It hasn’t yet exceeded the 2016 outburst; do you believe, even for a moment, that climate deniers will refrain from shouting “pause” — in spite of the fact that these data are the sum of random noise and that same relentless trend?

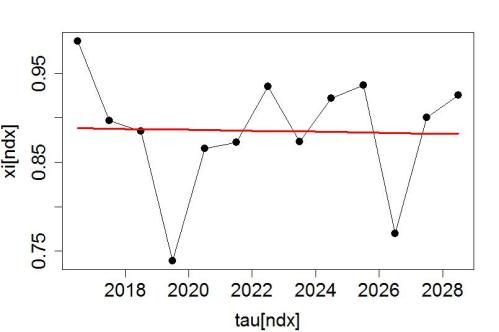
If I plot only that time span, even estimate a straight line trend (least squares again), I’d get this:


OMG! A fourteen-year streth with no trend at all! If anything, the globe is cooling!!! That’s what we’ll hear repeated over and over, In spite of the fact that these data are the sum of random noise and that same relentless trend. The impression of a pause is a combination of random chance with the fact that we started off with a big early peak.

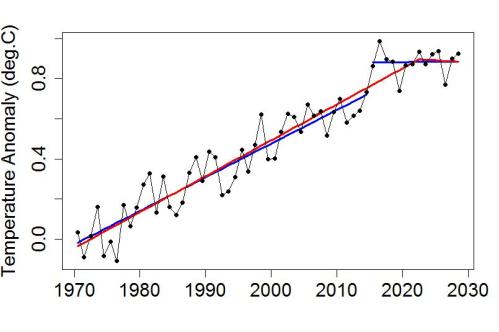
Is it really just an impression? Set aside for the moment the fact that these are artificial data made of random fluctuations and relentless trend. Let’s try some valid statistical analysis:


The best-fit unbroken trend change only gives a naive p-value of 0.089, not enough to call statistically significant, and that’s without correcting for the multiple testing problem. But the best-fit broken trend, starting with 2015, gives a naive p-value of 0.011. Significant at almost 99% confidence? No. Multiple testing problem.

Monte Carlo simulations can tell us what the real p-value is for that broken trend, 0.18. Not even close. After all, it really is just random noise plus relentless trend.

Of course one simulation isn’t the whole story. So I ran 10,000 simulations.

Only 3% of them showed a below-zero trend for 14 years or more, so it turns out my first simulation was a bit extreme, but only a bit. Fully 14% shows a below-zero trend for 12 years or more, and 40% show a below-zero trend for 10 years or longer. A whopping 73% had a below-zero trend for 8 years or more; that is more than enough for climate deniers not only to claim “pause,” but to declare “proof” that global warming “stopped in 2016.”

As for long stretches since 2016 without a new record high, that too is surprisingly common given the “head start” of cherry-picking the big outburst. Fully 6% of simulations included a 12-year stretch without breaking the 2016 record, 20% had a 10-year stretch, and 43% of simulations included an 8-year stretch with no record-breaker … long enough for Bob Carter to claim that global warming stopped whether it did or not.

Global warming marches on, but as long as fluctuations happen (and they will happen) there will be plenty of room for climate deniers to say it showed a “pause.” Now that they have a new super-cherry to cherry-pick, they will deny reality no matter what the future brings. They will likely base it on exploiting the fluctuations, in spite of the fact they have nothing to do with man-made climate change. Global warming isn’t the fluctuations.

Global warming is the relentless trend.

Global Warming: the Relentless Trend

Global warming is a fact that you better get use to!
This thread didn’t age well.

Michael Mann Refuses to Produce Data, Loses Case
 
Global Warming: the Relentless Trend
Posted on January 31, 2018 | 5 Comments
When it comes to global warming, recent years have been so hot that it worries even those who deny the problem exists.

No one more desperately needs global warming to end than those most against doing anything about it. That’s why they cling so tight to the notion of a “pause” in global warming, a “pause” that was never more than a false impression, hoping others would believe the myth that it had all somehow stopped. Its death by thermometer has hit them hard.


Yet they can look forward to new pauses to come. The year 2016 was so hot it shattered the previous record by a country mile, boosted as it was by the temperature spike which always follows a powerful el Niño. That leap upward, the hot flash Earth feels after el Niño strikes, when combined with the steady upward climbing that is global warming, yielded a powerful new peak, a highest high born of the unholy marriage of extreme fluctuation and relentless trend. It may become their new delight, this highest peak, a cherry more ripe and juicy than any before it.

And cherry-pick they will. That’s what happened after the 1998 el Niño. Way back in 2006 Bob Carter announced “There is a problem with global warming… it stopped in 1998.” It was bullshit then, it’s bullshit now, but climate deniers have made the most out of what they do best: bullshit. Bob Carter made the most of the biggest confusion about global warming, because most people don’t fully understand what global warming is. It has nothing to do with the perpetual fluctuations.

Global warming is the relentless trend.

The new cherry is so very cherry, a set-up for a whole new “pause” whether it exists or not. Just be sure to start with the big spike near the beginning; when you put such an outburst so early it’s too easy to get, and to give, the wrong idea about the trend. That’s why James Hansen and others have pointed out in a recent report that upcoming temperature data could give just such a false impression.


Therefore, because of the combination of the strong 2016 El Niño and the phase of the solar cycle, it is plausible, if not likely, that the next 10 years of global temperature change will leave an impression of a ‘global warming hiatus’.


We have been warned.

And it has already begun. The pause is coming! Witness Larry Kummer suggest that a new pause may have started already, a “pause perhaps lasting 10 or 15 years,” complete with funny picture to suggest that the “pause that never was,” was. Contrary to the impression one might get from Kummer’s piece, Hansen et al. didn’t suggest that a “pause” or “hiatus” may be on the way, they say that the impression may be. The distinction is at the very heart of the matter.

Just how likely is it then, that recent hot years can create such a false impression? Let’s suppose — just for the sake of argument, mind you — that global warming didn’t pause and isn’t going to. Rather it has been rising at a steady pace while fluctuating up and down randomly, and will continue to do so. Given that there’s no “pause” past or present, just random fluctuation and relentless trend, what might the future bring, and might it give the “impression of a global warming hiatus”?

It’s easy to simulate what might happen. Start with global temperature data (from NASA), yearly averages since 1970. Estimate the trend mathematically (least squares regression). Extend that trend line into the future, say, until 2050. That’s what the relentless trend will do, just keep on keepin’ on.

The first thing we note is that the trend alone doesn’t surpass the record high of 2016 until the year 2027. If the data from now on follow the same relentless trend with no noise, then from 2016 through 2026 we’ll have 11 years without breaking the 2016 record. How long will it take for climate deniers to declare a “pause”?

But we have no fluctuations to make the simulation realistic. So, use a random number generator to add simulated “noise” to the trend extension. Here’s one (the first one I got):


Could this give the “impression of a global warming hiatus”?

How about the 14-year period from 2016 through 2029?


It hasn’t yet exceeded the 2016 outburst; do you believe, even for a moment, that climate deniers will refrain from shouting “pause” — in spite of the fact that these data are the sum of random noise and that same relentless trend?

If I plot only that time span, even estimate a straight line trend (least squares again), I’d get this:


OMG! A fourteen-year streth with no trend at all! If anything, the globe is cooling!!! That’s what we’ll hear repeated over and over, In spite of the fact that these data are the sum of random noise and that same relentless trend. The impression of a pause is a combination of random chance with the fact that we started off with a big early peak.

Is it really just an impression? Set aside for the moment the fact that these are artificial data made of random fluctuations and relentless trend. Let’s try some valid statistical analysis:


The best-fit unbroken trend change only gives a naive p-value of 0.089, not enough to call statistically significant, and that’s without correcting for the multiple testing problem. But the best-fit broken trend, starting with 2015, gives a naive p-value of 0.011. Significant at almost 99% confidence? No. Multiple testing problem.

Monte Carlo simulations can tell us what the real p-value is for that broken trend, 0.18. Not even close. After all, it really is just random noise plus relentless trend.

Of course one simulation isn’t the whole story. So I ran 10,000 simulations.

Only 3% of them showed a below-zero trend for 14 years or more, so it turns out my first simulation was a bit extreme, but only a bit. Fully 14% shows a below-zero trend for 12 years or more, and 40% show a below-zero trend for 10 years or longer. A whopping 73% had a below-zero trend for 8 years or more; that is more than enough for climate deniers not only to claim “pause,” but to declare “proof” that global warming “stopped in 2016.”

As for long stretches since 2016 without a new record high, that too is surprisingly common given the “head start” of cherry-picking the big outburst. Fully 6% of simulations included a 12-year stretch without breaking the 2016 record, 20% had a 10-year stretch, and 43% of simulations included an 8-year stretch with no record-breaker … long enough for Bob Carter to claim that global warming stopped whether it did or not.

Global warming marches on, but as long as fluctuations happen (and they will happen) there will be plenty of room for climate deniers to say it showed a “pause.” Now that they have a new super-cherry to cherry-pick, they will deny reality no matter what the future brings. They will likely base it on exploiting the fluctuations, in spite of the fact they have nothing to do with man-made climate change. Global warming isn’t the fluctuations.

Global warming is the relentless trend.

Global Warming: the Relentless Trend

Global warming is a fact that you better get use to!
This thread didn’t age well.

Michael Mann Refuses to Produce Data, Loses Case


Mann is a despicable piece of shit.
 
Global Warming: the Relentless Trend
Posted on January 31, 2018 | 5 Comments
When it comes to global warming, recent years have been so hot that it worries even those who deny the problem exists.

No one more desperately needs global warming to end than those most against doing anything about it. That’s why they cling so tight to the notion of a “pause” in global warming, a “pause” that was never more than a false impression, hoping others would believe the myth that it had all somehow stopped. Its death by thermometer has hit them hard.


Yet they can look forward to new pauses to come. The year 2016 was so hot it shattered the previous record by a country mile, boosted as it was by the temperature spike which always follows a powerful el Niño. That leap upward, the hot flash Earth feels after el Niño strikes, when combined with the steady upward climbing that is global warming, yielded a powerful new peak, a highest high born of the unholy marriage of extreme fluctuation and relentless trend. It may become their new delight, this highest peak, a cherry more ripe and juicy than any before it.

And cherry-pick they will. That’s what happened after the 1998 el Niño. Way back in 2006 Bob Carter announced “There is a problem with global warming… it stopped in 1998.” It was bullshit then, it’s bullshit now, but climate deniers have made the most out of what they do best: bullshit. Bob Carter made the most of the biggest confusion about global warming, because most people don’t fully understand what global warming is. It has nothing to do with the perpetual fluctuations.

Global warming is the relentless trend.

The new cherry is so very cherry, a set-up for a whole new “pause” whether it exists or not. Just be sure to start with the big spike near the beginning; when you put such an outburst so early it’s too easy to get, and to give, the wrong idea about the trend. That’s why James Hansen and others have pointed out in a recent report that upcoming temperature data could give just such a false impression.


Therefore, because of the combination of the strong 2016 El Niño and the phase of the solar cycle, it is plausible, if not likely, that the next 10 years of global temperature change will leave an impression of a ‘global warming hiatus’.


We have been warned.

And it has already begun. The pause is coming! Witness Larry Kummer suggest that a new pause may have started already, a “pause perhaps lasting 10 or 15 years,” complete with funny picture to suggest that the “pause that never was,” was. Contrary to the impression one might get from Kummer’s piece, Hansen et al. didn’t suggest that a “pause” or “hiatus” may be on the way, they say that the impression may be. The distinction is at the very heart of the matter.

Just how likely is it then, that recent hot years can create such a false impression? Let’s suppose — just for the sake of argument, mind you — that global warming didn’t pause and isn’t going to. Rather it has been rising at a steady pace while fluctuating up and down randomly, and will continue to do so. Given that there’s no “pause” past or present, just random fluctuation and relentless trend, what might the future bring, and might it give the “impression of a global warming hiatus”?

It’s easy to simulate what might happen. Start with global temperature data (from NASA), yearly averages since 1970. Estimate the trend mathematically (least squares regression). Extend that trend line into the future, say, until 2050. That’s what the relentless trend will do, just keep on keepin’ on.

The first thing we note is that the trend alone doesn’t surpass the record high of 2016 until the year 2027. If the data from now on follow the same relentless trend with no noise, then from 2016 through 2026 we’ll have 11 years without breaking the 2016 record. How long will it take for climate deniers to declare a “pause”?

But we have no fluctuations to make the simulation realistic. So, use a random number generator to add simulated “noise” to the trend extension. Here’s one (the first one I got):


Could this give the “impression of a global warming hiatus”?

How about the 14-year period from 2016 through 2029?


It hasn’t yet exceeded the 2016 outburst; do you believe, even for a moment, that climate deniers will refrain from shouting “pause” — in spite of the fact that these data are the sum of random noise and that same relentless trend?

If I plot only that time span, even estimate a straight line trend (least squares again), I’d get this:


OMG! A fourteen-year streth with no trend at all! If anything, the globe is cooling!!! That’s what we’ll hear repeated over and over, In spite of the fact that these data are the sum of random noise and that same relentless trend. The impression of a pause is a combination of random chance with the fact that we started off with a big early peak.

Is it really just an impression? Set aside for the moment the fact that these are artificial data made of random fluctuations and relentless trend. Let’s try some valid statistical analysis:


The best-fit unbroken trend change only gives a naive p-value of 0.089, not enough to call statistically significant, and that’s without correcting for the multiple testing problem. But the best-fit broken trend, starting with 2015, gives a naive p-value of 0.011. Significant at almost 99% confidence? No. Multiple testing problem.

Monte Carlo simulations can tell us what the real p-value is for that broken trend, 0.18. Not even close. After all, it really is just random noise plus relentless trend.

Of course one simulation isn’t the whole story. So I ran 10,000 simulations.

Only 3% of them showed a below-zero trend for 14 years or more, so it turns out my first simulation was a bit extreme, but only a bit. Fully 14% shows a below-zero trend for 12 years or more, and 40% show a below-zero trend for 10 years or longer. A whopping 73% had a below-zero trend for 8 years or more; that is more than enough for climate deniers not only to claim “pause,” but to declare “proof” that global warming “stopped in 2016.”

As for long stretches since 2016 without a new record high, that too is surprisingly common given the “head start” of cherry-picking the big outburst. Fully 6% of simulations included a 12-year stretch without breaking the 2016 record, 20% had a 10-year stretch, and 43% of simulations included an 8-year stretch with no record-breaker … long enough for Bob Carter to claim that global warming stopped whether it did or not.

Global warming marches on, but as long as fluctuations happen (and they will happen) there will be plenty of room for climate deniers to say it showed a “pause.” Now that they have a new super-cherry to cherry-pick, they will deny reality no matter what the future brings. They will likely base it on exploiting the fluctuations, in spite of the fact they have nothing to do with man-made climate change. Global warming isn’t the fluctuations.

Global warming is the relentless trend.

Global Warming: the Relentless Trend

Global warming is a fact that you better get use to!
This thread didn’t age well.

Michael Mann Refuses to Produce Data, Loses Case


Mann is a despicable piece of shit.
Yep. We knew he was a con artist the second he refused to show his data. But the anti-science Left treated him as the Messiah to push for the destruction of our civilization.
 

Forum List

Back
Top