Great news. More land to grow crops on now that the Little Ice Age is ending.From the polar caps to the glaciers of Europe, Asia and South America, global warming is melting the planet’s ice faster than ever and speeding the inundation of the world’s coastlines.
New research shows the annual melt rate grew from 0.8 trillion tons in the 1990s to 1.3 trillion tons by 2017, and has accelerated most in the places with the most ice—the Greenland and Antarctic ice shelves and sheets.
Those massive systems of land and sea-based ice are melting as fast as the worst-case climate scenarios in major global climate reports, said Thomas Slater, a co-author of the new study in The Cryosphere that measured the meltdown from 1994 to 2017, which covers a timespan when every decade was warmer than the previous one and also includes the 20 warmest years on record.

Global Ice Loss on Pace to Drive Worst-Case Sea Level Rise - Inside Climate News
From the polar caps to the glaciers of Europe, Asia and South America, global warming is melting the planet’s ice faster than ever and speeding the inundation of the world’s coastlines. New research shows the annual melt rate grew from 0.8 trillion tons in the 1990s to 1.3 trillion tons by 2017...insideclimatenews.org
*****************
Thank Heaven’s we have a wonderful new President who is taking this threat seriously.
Navigation
Install the app
How to install the app on iOS
Follow along with the video below to see how to install our site as a web app on your home screen.

Note: This feature currently requires accessing the site using the built-in Safari browser.
More options
You are using an out of date browser. It may not display this or other websites correctly.
You should upgrade or use an alternative browser.
You should upgrade or use an alternative browser.
Global Ice loss accelerating.
- Thread starter JLW
- Start date
Oh NOEZ!From the polar caps to the glaciers of Europe, Asia and South America, global warming is melting the planet’s ice faster than ever and speeding the inundation of the world’s coastlines.
New research shows the annual melt rate grew from 0.8 trillion tons in the 1990s to 1.3 trillion tons by 2017, and has accelerated most in the places with the most ice—the Greenland and Antarctic ice shelves and sheets.
Those massive systems of land and sea-based ice are melting as fast as the worst-case climate scenarios in major global climate reports, said Thomas Slater, a co-author of the new study in The Cryosphere that measured the meltdown from 1994 to 2017, which covers a timespan when every decade was warmer than the previous one and also includes the 20 warmest years on record.
Global Ice Loss on Pace to Drive Worst-Case Sea Level Rise - Inside Climate News
From the polar caps to the glaciers of Europe, Asia and South America, global warming is melting the planet’s ice faster than ever and speeding the inundation of the world’s coastlines. New research shows the annual melt rate grew from 0.8 trillion tons in the 1990s to 1.3 trillion tons by 2017...
*****************
Thank Heaven’s we have a wonderful new President who is taking this threat seriously.
.

The source..."The Cryosphere" is apparently a consortium of European global warming activists. The claim is based on alleged interpretation of satellite data and the numerical components of computer "models". The accuracy of computer models to predict weather patterns a month from now are questionable. Factor in an activist organization's ability to fudge a couple of numbers in their computer graphics and you could get the same kind of junk that predicted the end of the world in 2020.
Sunsettommy
Diamond Member
- Mar 19, 2018
- 14,884
- 12,518
- 2,400
easyt65
Diamond Member
- Aug 4, 2015
- 90,307
- 61,071
- 2,645
From the polar caps to the glaciers of Europe, Asia and South America, global warming is melting the planet’s ice faster than ever and speeding the inundation of the world’s coastlines.
New research shows the annual melt rate grew from 0.8 trillion tons in the 1990s to 1.3 trillion tons by 2017, and has accelerated most in the places with the most ice—the Greenland and Antarctic ice shelves and sheets.
Those massive systems of land and sea-based ice are melting as fast as the worst-case climate scenarios in major global climate reports, said Thomas Slater, a co-author of the new study in The Cryosphere that measured the meltdown from 1994 to 2017, which covers a timespan when every decade was warmer than the previous one and also includes the 20 warmest years on record.
Global Ice Loss on Pace to Drive Worst-Case Sea Level Rise - Inside Climate News
From the polar caps to the glaciers of Europe, Asia and South America, global warming is melting the planet’s ice faster than ever and speeding the inundation of the world’s coastlines. New research shows the annual melt rate grew from 0.8 trillion tons in the 1990s to 1.3 trillion tons by 2017...
*****************
Thank Heaven’s we have a wonderful new President who is taking this threat seriously.
Be gone, you fear-mongering witch, before someone drops a house on you.

Brrr… Arctic Sea Ice Melt the Lowest in 15 Years, Antactic Sea Ice Above Average
Brrr... Arctic Sea Ice Melt the Lowest in 15 Years, Antarctic Sea Ice Above Average | The Gateway Pundit | by Jim Hoft
Do you remember when AOC said we had only 12 years left on the planet due to “climate change”?
That's what happens in an interglacial cycle, John.From the polar caps to the glaciers of Europe, Asia and South America, global warming is melting the planet’s ice faster than ever and speeding the inundation of the world’s coastlines.
New research shows the annual melt rate grew from 0.8 trillion tons in the 1990s to 1.3 trillion tons by 2017, and has accelerated most in the places with the most ice—the Greenland and Antarctic ice shelves and sheets.
Those massive systems of land and sea-based ice are melting as fast as the worst-case climate scenarios in major global climate reports, said Thomas Slater, a co-author of the new study in The Cryosphere that measured the meltdown from 1994 to 2017, which covers a timespan when every decade was warmer than the previous one and also includes the 20 warmest years on record.
Global Ice Loss on Pace to Drive Worst-Case Sea Level Rise - Inside Climate News
From the polar caps to the glaciers of Europe, Asia and South America, global warming is melting the planet’s ice faster than ever and speeding the inundation of the world’s coastlines. New research shows the annual melt rate grew from 0.8 trillion tons in the 1990s to 1.3 trillion tons by 2017...
*****************
Thank Heaven’s we have a wonderful new President who is taking this threat seriously.
That ice is melting because of greenhouse warming acting on the CO2 humans have put in the air. I'm still waiting for your explanation as to why you think CO2 ISN'T warming the planet. You've yet to give us a single word on that question. Makes me think the reason is that you haven't a fucking clue. Show me I'm wrong.
Last edited:
The ice has been melting for over 20,000 years. We are in an interglacial cycle. That's what happens in an interglacial cycle.That ice is melting because of greenhouse warming acting on the CO2 humans have put in the air. I'm still waiting for your explanation as to why you think CO2 ISN'T warming the planet. You've yet to give us a single word on that question. Makes me think the reason is that you haven't a fucking clue. Show me I'm wrong.
How many times do I have to explain this to you. CO2 is a minor greenhouse gas that has never been shown to drive the climate. The warming we is related to natural variations in the sun.
So, you believe that CO2 could not be warming the planet because it is a "minor greenhouse gas" and you believe the warming we've experienced is due to natural variations in the sun.
The radiant forcing of different gases can be calculated from first priciples. The results look like this, which also includes net warming from TSI changes:


 www.epa.gov
So, all by itself, these data say you are wrong on both counts. I can find the same data from a half a dozen other reputable sources. What has led you to your conclusions?
The radiant forcing of different gases can be calculated from first priciples. The results look like this, which also includes net warming from TSI changes:
Climate Change Indicators: Climate Forcing | US EPA
This indicator measures the “radiative forcing” or heating effect caused by greenhouse gases in the atmosphere.
www.epa.gov
So, all by itself, these data say you are wrong on both counts. I can find the same data from a half a dozen other reputable sources. What has led you to your conclusions?
Yep. That's exactly what I believe. I even have the datasets to prove it.So, you believe that CO2 could not be warming the planet because it is a "minor greenhouse gas" and you believe the warming we've experienced is due to natural variations in the sun.
The radiant forcing of different gases can be calculated from first priciples. The results look like this, which also includes net warming from TSI changes:
View attachment 541973
Climate Change Indicators: Climate Forcing | US EPA
This indicator measures the “radiative forcing” or heating effect caused by greenhouse gases in the atmosphere.
So, all by itself, these data say you are wrong on both counts. I can find the same data from a half a dozen other reputable sources. What has led you to your conclusions?
")
scientists come to opposite conclusions about the causes of recent climate change depending on which datasets they consider. For instance, in the graphs above, the panels on the left lead to the conclusion that global temperature changes since the mid-19th century have been mostly due to human-caused emissions, especially carbon dioxide (CO2), i.e., the conclusion reached by the UN IPCC reports. In contrast, the panels on the right lead to the exact opposite conclusion, i.e., that the global temperature changes since the mid-19th century have been mostly due to natural cycles, chiefly long-term changes in the energy emitted by the Sun.
Both sets of panels are based on published scientific data, but each uses different datasets and assumptions. On the left, it is assumed that the available temperature records are unaffected by the urban heat island problem, and so all stations are used, whether urban or rural. On the right, only rural stations are used. Meanwhile, on the left, solar output is modeled using the low variability dataset that has been chosen for the IPCC’s upcoming (in 2021/2022) 6th Assessment Reports. This implies zero contribution from natural factors to the long-term warming. On the right, solar output is modeled using a high variability dataset used by the team in charge of NASA’s ACRIM sun-monitoring satellites. This implies that most, if not all, of the long-term temperature changes are due to natural factors.
Here is the link to the full paper.
https://iopscience.iop.org/article/10.1088/1674-4527/21/6/131/pdf
Prior to the industrial revolution CO2 was a proxy for temperature. CO2 would correlate with temperature and sea level. Post industrial revolution CO2 correlates with emissions but not temperature and sea level.So, you believe that CO2 could not be warming the planet because it is a "minor greenhouse gas" and you believe the warming we've experienced is due to natural variations in the sun.
The radiant forcing of different gases can be calculated from first priciples. The results look like this, which also includes net warming from TSI changes:
View attachment 541973
Climate Change Indicators: Climate Forcing | US EPA
This indicator measures the “radiative forcing” or heating effect caused by greenhouse gases in the atmosphere.
So, all by itself, these data say you are wrong on both counts. I can find the same data from a half a dozen other reputable sources. What has led you to your conclusions?
It seems their case for CO2 driving climate change is based upon the fact that CO2 is a greenhouse gas and that temperatures have been rising. The problem is that CO2 is a minor greenhouse gas, the rate of sea level rise has not changed and temperatures are still below the peak temperatures of previous interglacials. So it would be expected for temperatures to rise as we have not yet completed the interglacial cycle.
They will argue that the rate temperatures are rising is unprecedented. Unfortunately that's not true. 25 D-O events during the last glacial cycle show that temperatures rose from glacial temperatures to interglacial temperatures - 5C swings up and down - over the course of a few decades. That's even on NASA's website.
Here's what's really happening... we entered an ice age 2.7 million years ago. You can see the slope change on the oxygen isotope curve which is the well established proxy for temperatures. No one disputes the curve. The drivers were a gradually cooling of the planet coupled with the polar regions being isolated from warm marine currents; the south pole has a continent parked on top of it and the north pole has a mostly landlocked ocean on top of it. Also the rise of the Himalayas and the Panama isthmus. All these things changed the circulation patterns of the atmosphere and the ocean, but the biggest driver was both polar regions being isolated from the warmer marine currents.
But the glaciation threshold is different for each pole. Because the south pole has a continent parked on top of it, the southern hemisphere has a lower threshold for extensive continental glaciation than the northern hemisphere does because the north pole has an ocean parked over it. It is this difference which created increased climate fluctuation and environmental uncertainty on the earth. It is the northern hemisphere which dominates the climate of the earth. The coolest average temperatures occurs when the northern hemisphere is in winter and the warmest average temperatures occur when the northern hemisphere is in summer. Again... that's even on NASA's website.
You can see from ice cores during the last glacial cycle how much more erratic temperatures were in the northern hemisphere. By the way these are the D-O events from the Greenland ice cores. My point is that it is not unusual for there to be large temperature swings because that is the signature of the present ice age. We live in a period of bipolar glaciation. Never before has the earth been configured for bipolar glaciation. It is because we have bipolar glaciation where the poles do not have the same glaciation threshold that has led to increased climate fluctuation and environmental uncertainty on the earth. They have mistakenly correlated a period of warming and associated it with an increase from a minor greenhouse gas.
Here's the oxygen isotope curve.
Here is a zoomed in view of the oxygen isotope curve showing the transition from a greenhouse planet to an icehouse planet which clearly shows the increased climate fluctuation and environmental uncertainty of the earth's climate.
And here is the climate data from the southern and northern hemisphere ice cores for the last glacial period where you can clearly see how much more erratic the climate of the northern hemisphere was compared to the southern hemisphere.
- May 20, 2009
- 144,087
- 66,359
- 2,330
That's probably when the pyramids were builtIt was 30,000 years ago and became arid desert as the glaciers retreated in the north. Before that the Arabian peninsula was a savanna with shallow lakes. I have seen hundreds of core samples in Arabia.
Old Rocks
Diamond Member
Like the orange ass they kiss, these "Conservatives" cannot help themselves, they just have to lie.
Video: Antarctic Ice Mass Loss 2002-2023
Animation showing changes in Antarctic ice mass since 2002 based on satellite data.
Video: Greenland Ice Mass Loss 2002-2023
Animation showing changes in Greenland ice mass since 2002 based on satellite data.
What bullshit.That's probably when the pyramids were built
The Giza Pyramids, built to endure an eternity, have done just that. The monumental tombs are relics of Egypt's Old Kingdom era and were constructed some 4,500 years ago.
Attachments

- May 20, 2009
- 144,087
- 66,359
- 2,330
There's absolutely no fucking way the Egyptians built the Pyramids with their primitive tools.Like the orange ass they kiss, these "Conservatives" cannot help themselves, they just have to lie.
Video: Antarctic Ice Mass Loss 2002-2023
Animation showing changes in Antarctic ice mass since 2002 based on satellite data.climate.nasa.gov
Video: Greenland Ice Mass Loss 2002-2023
Animation showing changes in Greenland ice mass since 2002 based on satellite data.
What bullshit.
The Giza Pyramids, built to endure an eternity, have done just that. The monumental tombs are relics of Egypt's Old Kingdom era and were constructed some 4,500 years ago.
Sunsettommy
Diamond Member
- Mar 19, 2018
- 14,884
- 12,518
- 2,400
Like the orange ass they kiss, these "Conservatives" cannot help themselves, they just have to lie.
Video: Antarctic Ice Mass Loss 2002-2023
Animation showing changes in Antarctic ice mass since 2002 based on satellite data.
Video: Greenland Ice Mass Loss 2002-2023
Animation showing changes in Greenland ice mass since 2002 based on satellite data.
What bullshit.
The Giza Pyramids, built to endure an eternity, have done just that. The monumental tombs are relics of Egypt's Old Kingdom era and were constructed some 4,500 years ago.
Your blind stupidity never rests, my charts start in 1900 which shows no visible change in overall mass in 120 years while your misleading link doesn't explain how small the melt is compared to total mass of the ice fields and in just 17 years of data some of it under dispute since Grace measurements have significant error range in them.
Let's see if you can understand the concept of massive numbers of the entire Glacial ice mass of Greenland versus a few years of small melting ice numbers:
"From that data, we find that the 1981 – 2010 thirty-year average mass balance for the Greenland ice sheet was a net loss of 103 billion tonnes. Again, this is a very large number, it seems like a big deal that would demand our attention … but is it really?
In order to ask the question “How big is 103 billion tonnes?”, we have to ask a related question:
“Compared to what?”
In this case, the answer is, “Compared to the total amount of ice on Greenland”.
Here’s one way of looking at that. We can ask, IF Greenland were to continue losing ice mass at a rate of 103 billion tonnes per year, how long would it take to melt say half of the ice sheet? Not all of it, mind you, but half of it. (Note that I am NOT saying that extending a current trend is a way to estimate the future evolution of the ice sheet—I’m merely using it as a way to compare large numbers.)
To answer our question if 103 billion tonnes lost per year is a big number, we have to compare the annual ice mass loss to the amount of ice in the Greenland ice sheet. The Greenland ice sheet contains about 2.6E+15 (2,600,000,000,000,000) tonnes of water in the form of snow and ice.
So IF the Greenland ice sheet were to lose 103 billion tonnes per year into the indefinite future, it would take about twelve thousand five hundred years to lose half of it …"
LINK
=====
It has been estimated that Greenland did lose around HALF of it mass in the previous Eemian interglacial period, yet the world rolled along, and Polar Bears are still with us.
Sunsettommy
Diamond Member
- Mar 19, 2018
- 14,884
- 12,518
- 2,400
I watch this show about a family who lives in Alaska. They always talk about a glacier that used to be in their view when they were younger that is no longer there.
Awww you forget that those Glaciers including Glacier Bay started retreating long before 1850 came around because the LIA phase started dissipating in the 1700's, which is why many glaciers that grew for centuries during the LIA stopped and began their retreat as the world warmed up.
Sunsettommy
Diamond Member
- Mar 19, 2018
- 14,884
- 12,518
- 2,400
Meanwhile the end of the year sea ice cover in the Arctic is the highest since 2003, while there has been NO MORE sea ice decline since 2006:
Real Climate Science
Highest Arctic Sea Ice Extent In Eighteen Years
Posted onDecember 31, 2021bytonyheller
This year finished up with the highest Arctic Sea ice extent since 2003.

LINK
======
No decline since 2007 in the Arctic by October 1.

Both SII and MASIE are from NSIDC and NOAA
From Science Matters
LINK
=====
From NSIDC:
FAQs
1. What is the difference between this product and the Sea Ice Index? The Sea Ice Index has a daily view, too.
The Sea Ice Index (SII) relies on satellite passive microwave data as its only data source. These data are automatically processed using an algorithm and have known biases and limitations; these are covered in the SII documentation. MASIE relies on data from the Interactive Multisensor Snow and Ice Mapping System (IMS) that runs at the U.S. National Ice Center (USNIC). The IMS product uses several satellite data sources including passive microwave, but it is also based on visual analysis and other data sources and undergoes a form of manual data fusion. Another difference is in the resolution of the products. The MASIE product has a nominal 4-km resolution which is higher than the nominal 25-km resolution of the SII.
LINK
=====
The decline trend has stopped 14 years ago, but warmist/alarmists are too wedded to their stupid brainless climate cult to accept data-based reality.
Real Climate Science
Highest Arctic Sea Ice Extent In Eighteen Years
Posted onDecember 31, 2021bytonyheller
This year finished up with the highest Arctic Sea ice extent since 2003.
LINK
======
No decline since 2007 in the Arctic by October 1.
Both SII and MASIE are from NSIDC and NOAA
From Science Matters
LINK
=====
From NSIDC:
FAQs
1. What is the difference between this product and the Sea Ice Index? The Sea Ice Index has a daily view, too.
The Sea Ice Index (SII) relies on satellite passive microwave data as its only data source. These data are automatically processed using an algorithm and have known biases and limitations; these are covered in the SII documentation. MASIE relies on data from the Interactive Multisensor Snow and Ice Mapping System (IMS) that runs at the U.S. National Ice Center (USNIC). The IMS product uses several satellite data sources including passive microwave, but it is also based on visual analysis and other data sources and undergoes a form of manual data fusion. Another difference is in the resolution of the products. The MASIE product has a nominal 4-km resolution which is higher than the nominal 25-km resolution of the SII.
LINK
=====
The decline trend has stopped 14 years ago, but warmist/alarmists are too wedded to their stupid brainless climate cult to accept data-based reality.
- Mar 3, 2006
- 7,190
- 2,554
- 315
Meanwhile the end of the year sea ice cover in the Arctic is the highest since 2003, while there has been NO MORE sea ice decline since 2006:
Real Climate Science
Highest Arctic Sea Ice Extent In Eighteen Years
Posted onDecember 31, 2021bytonyheller
This year finished up with the highest Arctic Sea ice extent since 2003.
View attachment 582127
LINK
======
No decline since 2007 in the Arctic by October 1.
View attachment 582128
Both SII and MASIE are from NSIDC and NOAA
From Science Matters
LINK
=====
From NSIDC:
FAQs
1. What is the difference between this product and the Sea Ice Index? The Sea Ice Index has a daily view, too.
The Sea Ice Index (SII) relies on satellite passive microwave data as its only data source. These data are automatically processed using an algorithm and have known biases and limitations; these are covered in the SII documentation. MASIE relies on data from the Interactive Multisensor Snow and Ice Mapping System (IMS) that runs at the U.S. National Ice Center (USNIC). The IMS product uses several satellite data sources including passive microwave, but it is also based on visual analysis and other data sources and undergoes a form of manual data fusion. Another difference is in the resolution of the products. The MASIE product has a nominal 4-km resolution which is higher than the nominal 25-km resolution of the SII.
LINK
=====
The decline trend has stopped 14 years ago, but warmist/alarmists are too wedded to their stupid brainless climate cult to accept data-based reality.
A Propagandized PIECE of CHERRY PICKING
The classic "Going Down the Up Escalator.
Using a ONE MONTH (Only SEPTEMBER) Graph and 18 years only.
But in Fact until the recent increase, and since 1979, 40 years of Decline.
Climate.NASA.Gov
Arctic Sea Ice Extent
In Brief:
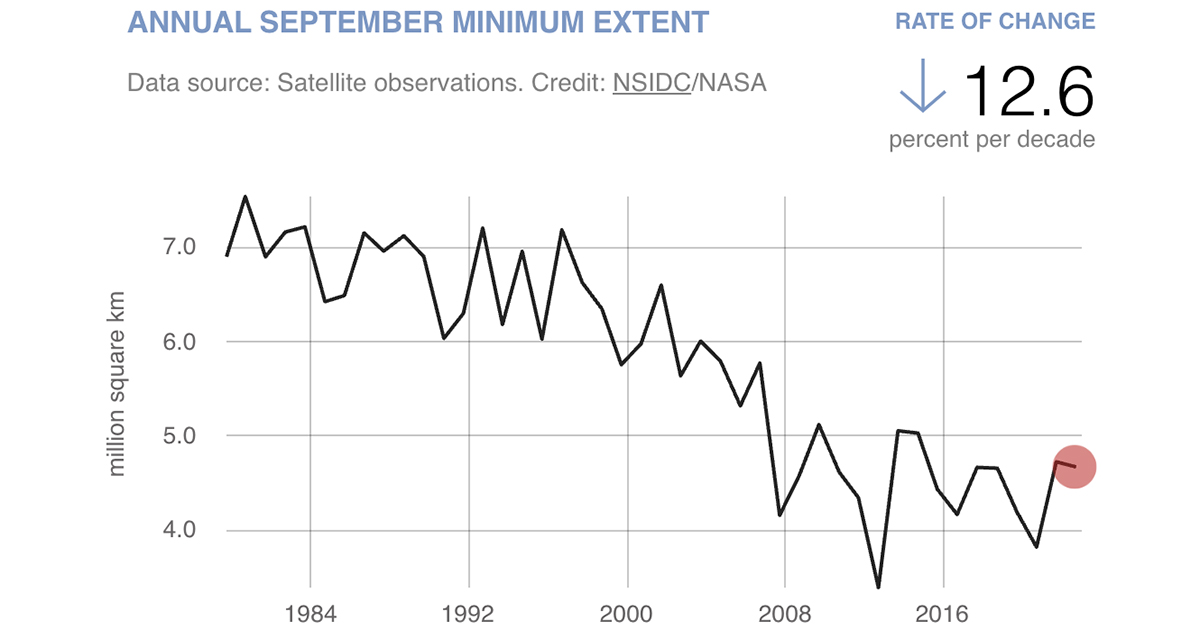
Arctic sea ice extent has declined significantly in all months since satellite measurements began in 1979, with Septembers showing the largest declines. The last 15 Septembers show the lowest values.Arctic sea ice reaches its minimum each September.
September Arctic sea ice is now declining at a rate of 13% per decade, relative to the 1981 to 2010 average.
This graph shows the annual Arctic sea ice minimum each September since 1979, derived from satellite observations.
The animated time series below shows the annual Arctic sea ice minimum since 1979, based on satellite observations. The 2012 sea ice extent is the lowest in the satellite record.[/B]
Arctic Sea Ice Minimum | NASA Global Climate Change
Vital Signs of the Planet: Global Climate Change and Global Warming. Current news and data streams about global warming and climate change from NASA.
Additional Graphic at Link with Ice cover 1979-2021.
`
Last edited:
- May 20, 2009
- 144,087
- 66,359
- 2,330
Meanwhile the end of the year sea ice cover in the Arctic is the highest since 2003, while there has been NO MORE sea ice decline since 2006:
Real Climate Science
Highest Arctic Sea Ice Extent In Eighteen Years
Posted onDecember 31, 2021bytonyheller
This year finished up with the highest Arctic Sea ice extent since 2003.
View attachment 582127
LINK
======
No decline since 2007 in the Arctic by October 1.
View attachment 582128
Both SII and MASIE are from NSIDC and NOAA
From Science Matters
LINK
=====
From NSIDC:
FAQs
1. What is the difference between this product and the Sea Ice Index? The Sea Ice Index has a daily view, too.
The Sea Ice Index (SII) relies on satellite passive microwave data as its only data source. These data are automatically processed using an algorithm and have known biases and limitations; these are covered in the SII documentation. MASIE relies on data from the Interactive Multisensor Snow and Ice Mapping System (IMS) that runs at the U.S. National Ice Center (USNIC). The IMS product uses several satellite data sources including passive microwave, but it is also based on visual analysis and other data sources and undergoes a form of manual data fusion. Another difference is in the resolution of the products. The MASIE product has a nominal 4-km resolution which is higher than the nominal 25-km resolution of the SII.
LINK
=====
The decline trend has stopped 14 years ago, but warmist/alarmists are too wedded to their stupid brainless climate cult to accept data-based reality.
Highest Arctic Sea Ice Extent In Eighteen Years, due to manmade global climate warming change
That's what happens in an interglacial cycle of an ice age, dummy.A Propagandized PIECE of CHERRY PICKING
The classic "Going Down the Up Escalator.
Using a ONE MONTH (Only SEPTEMBER) Graph and 18 years only.
But in Fact until the recent increase, and since 1979, 40 years of Decline.
Climate.NASA.Gov
Arctic Sea Ice Extent
In Brief:
Arctic sea ice extent has declined significantly in all months since satellite measurements began in 1979, with Septembers showing the largest declines. The last 15 Septembers show the lowest values.
Arctic sea ice reaches its minimum each September.
September Arctic sea ice is now declining at a rate of 13% per decade, relative to the 1981 to 2010 average.
This graph shows the annual Arctic sea ice minimum each September since 1979, derived from satellite observations.
The animated time series below shows the annual Arctic sea ice minimum since 1979, based on satellite observations. The 2012 sea ice extent is the lowest in the satellite record.[/B]
Arctic Sea Ice Minimum | NASA Global Climate Change
Vital Signs of the Planet: Global Climate Change and Global Warming. Current news and data streams about global warming and climate change from NASA.climate.nasa.gov
View attachment 582245
Additional Graphic at Link with Ice cover 1979-2021.
`
Similar threads
- Replies
- 118
- Views
- 2K
- Replies
- 573
- Views
- 6K
- Replies
- 63
- Views
- 1K
Latest Discussions
- Replies
- 328
- Views
- 3K
- Replies
- 27
- Views
- 203
- Replies
- 802
- Views
- 77K
Forum List
-
-
-
-
-
Political Satire 8018
-
-
-
-
-
-
-
-
-
-
-
-
-
-
-
-
-
-
-
ObamaCare 781
-
-
-
-
-
-
-
-
-
-
-
Member Usernotes 466
-
-
-
-
-
-
-
-
-
-