Navigation
Install the app
How to install the app on iOS
Follow along with the video below to see how to install our site as a web app on your home screen.

Note: This feature currently requires accessing the site using the built-in Safari browser.
More options
You are using an out of date browser. It may not display this or other websites correctly.
You should upgrade or use an alternative browser.
You should upgrade or use an alternative browser.
Food Stamp Participation: Higher Rate of Intensity in Democratic Counties
- Thread starter Bush92
- Start date
NYcarbineer
Diamond Member
Here are SNAP participants by county. From, of all places, the Daily Kos. Darker areas have more people on food stamps.

Gee, here's a map of US population density:

See a correlation THERE?
lol, dumbass...
NYcarbineer
Diamond Member
The OP profundity here is that, amazingly, there are fewer food stamp recipients in Garfield County, Montana,
population 1200,
than there are in Miami-Dade County, Florida,
population 2.5 million.
...we need a duh! dial that goes up to 11 to measure this one!
population 1200,
than there are in Miami-Dade County, Florida,
population 2.5 million.
...we need a duh! dial that goes up to 11 to measure this one!
Delta4Embassy
Gold Member
Here are SNAP participants by county. From, of all places, the Daily Kos. Darker areas have more people on food stamps.
Here is the vote by county in 2012 for Obama and Romney...

See a a pattern here...
Might behoove you to look into military SNAP recipiants before trying to make SNAP a political thing.
"Why don't Republicans support raising military pay to get service men and women and their families off public assistance programs like SNAP?"
is the consequence of such political rhetoric.
Bush92
GHBush1992
- May 23, 2014
- 34,808
- 10,702
- 1,400
- Thread starter
- #5
You can't read a chart huh?Here are SNAP participants by county. From, of all places, the Daily Kos. Darker areas have more people on food stamps.
Here is the vote by county in 2012 for Obama and Romney...
See a a pattern here...
Might behoove you to look into military SNAP recipiants before trying to make SNAP a political thing.
"Why don't Republicans support raising military pay to get service men and women and their families off public assistance programs like SNAP?"
is the consequence of such political rhetoric.
Delta4Embassy
Gold Member
So we all agree that democrats live close together and suck welfare.
Ok!
Along with underpaid military members. Most of whom are Republicans.
So we all agree that democrats live close together and suck welfare.
Ok!
Along with underpaid military members. Most of whom are Republicans.
I'll give members of the military a pass.
NYcarbineer
Diamond Member
Here's the actual percentage of food stamp recipients by state, which is what the OP probably thought he was doing:
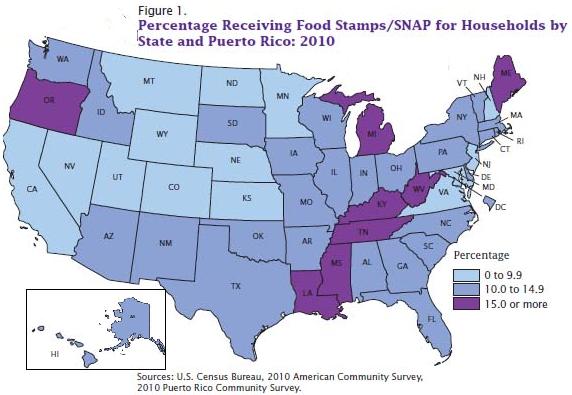
As the above chart makes clear, there is no red state/blue state correlation.
You might happen to notice that California is doing better than every state in the GOP South...
As the above chart makes clear, there is no red state/blue state correlation.
You might happen to notice that California is doing better than every state in the GOP South...
SuperDemocrat
Gold Member
- Mar 4, 2015
- 8,200
- 868
- 275
- Banned
- #11
Here are SNAP participants by county. From, of all places, the Daily Kos. Darker areas have more people on food stamps.
Here is the vote by county in 2012 for Obama and Romney...
See a a pattern here...
One day republicans will figure out that if you want to create a democratic voter you hook them up to government life support machine known as food stamps. They won't vote for the guy who they think will pull the plug on the thing that keeps them alive.
bedowin62
Gold Member
- Feb 6, 2014
- 17,997
- 2,025
- 280
Here's the actual percentage of food stamp recipients by state, which is what the OP probably thought he was doing:
As the above chart makes clear, there is no red state/blue state correlation.
You might happen to notice that California is doing better than every state in the GOP South...
um no they arent leftard
try again
- Apr 10, 2013
- 23,667
- 1,880
- 265
R
rdean
Guest
20% of West Virginia on food stamps when 94% of the state is white????
Didn't see that coming.
- May 23, 2012
- 10,511
- 2,333
- 280
Wonder what the republican solution is for people in need. Work houses? Dumpster diving? We tried a republican in the white house for 8 years and that didn't work out too good, that's for sure.
- Apr 10, 2013
- 23,667
- 1,880
- 265
20% of West Virginia on food stamps when 94% of the state is white????
Didn't see that coming.
Take a trip to West Virginia....it's a REAL eye opener.
NYcarbineer
Diamond Member
20% of West Virginia on food stamps when 94% of the state is white????
Didn't see that coming.
Take a trip to West Virginia....it's a REAL eye opener.
As is this:
The Poorest Counties in the US:
List of lowest-income counties in the United States - Wikipedia the free encyclopedia
NYcarbineer
Diamond Member
Here's the actual percentage of food stamp recipients by state, which is what the OP probably thought he was doing:
As the above chart makes clear, there is no red state/blue state correlation.
You might happen to notice that California is doing better than every state in the GOP South...
um no they arent leftard
try again
Do you want a reading lesson, or some glasses?
Similar threads
- Replies
- 90
- Views
- 1K
- Replies
- 31
- Views
- 786
- Replies
- 13
- Views
- 321
- Replies
- 100
- Views
- 7K
Latest Discussions
- Replies
- 5
- Views
- 15
- Replies
- 47
- Views
- 192
- Replies
- 3
- Views
- 10
- Replies
- 857
- Views
- 7K
Forum List
-
-
-
-
-
Political Satire 8002
-
-
-
-
-
-
-
-
-
-
-
-
-
-
-
-
-
-
-
ObamaCare 781
-
-
-
-
-
-
-
-
-
-
-
Member Usernotes 465
-
-
-
-
-
-
-
-
-
-