
ScienceRocks
Democrat all the way!
- Banned
- #1
CO2 emissions +2.2% in 2012, driven by China and coal
Nov 19, 2013
Nov 19, 2013
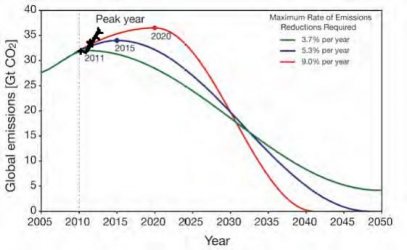
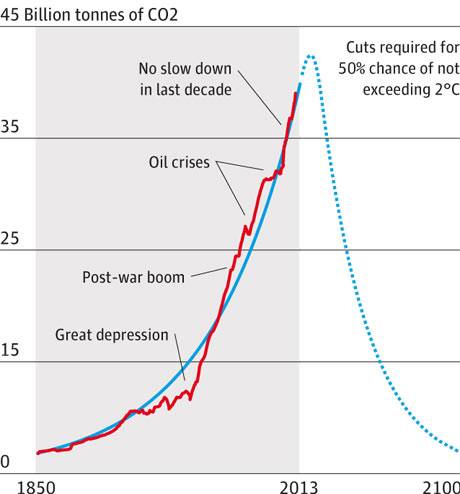
Read more at: CO2 emissions +2.2% in 2012, driven by China and coalEmissions of carbon dioxide from fossil fuels and cement production reached a new high in 2012, rising 2.2 percent over 2011 due chiefly to an increase in coal-burning China, scientists said Tuesday.
Output of CO2 from these sources was a record 35 billion tonnes, 58 percent above 1990, the benchmark year for calculating greenhouse-gas levels, according to the annual analysis by an international group called the Global Carbon Project.
"Based on estimates of economic activity in 2013, emissions are set to rise 2.1 percent in 2013 to reach 36 billion tonnes of CO2," it said in a report coinciding with the UN climate talks in Warsaw.
The 2012 and 2013 rates are slightly below the average growth of 2.7 percent annually over the last 10 years.
Carbin dioxide is the principal greenhouse gas, and fossil fuels—coal, oil and gas—along with cement production account for nearly all its man-made emissions. Around four billion tonnes of CO2 come from other sources, including changes to land use, the report said.
China, the world's number one carbon emitter, accounted for 70 percent of the global increase in 2012, it said.
Chinese emissions grew 5.9 percent in 2012, lower than the average of 7.9 percent per year over the past decade.
Consumption from renewable sources and hydropower in China grew by a quarter in 2012.
But that growth came from a low baseline, and was more than offset by an increase of 6.4 percent in coal, which has a higher baseline. Coal accounted for 68 percent of Chinese energy consumption in 2012.
Other significant CO2 increases occurred in Japan (+6.9 percent) and Germany (+1.8 percent), pushed by a switch to coal to offset dependence on nuclear.
Indian emissions increased by a whopping 7.7 percent, with those from coal growing 10.2 percent.
Last edited:


