Sunsettommy
Diamond Member
- Mar 19, 2018
- 14,884
- 12,518
- 2,400
No trolling, off topic complaining and no attack on the source or the writer. I do request replying on the CONTENT of the article, good or bad.
Real Climate Science
Are Government Temperature Graphs Credible?
Posted on April 7, 2021 by tonyheller
Excerpt:
Ninety years ago, the New York Times reported unanimous consensus that Earth’s climate was controlled by the sun.
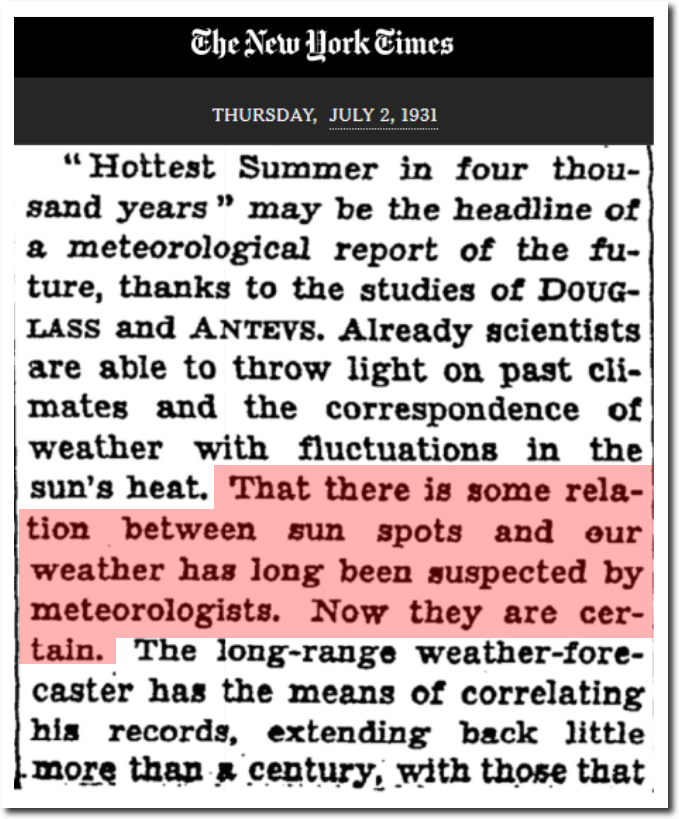
TimesMachine: July 2, 1931 – NYTimes.com
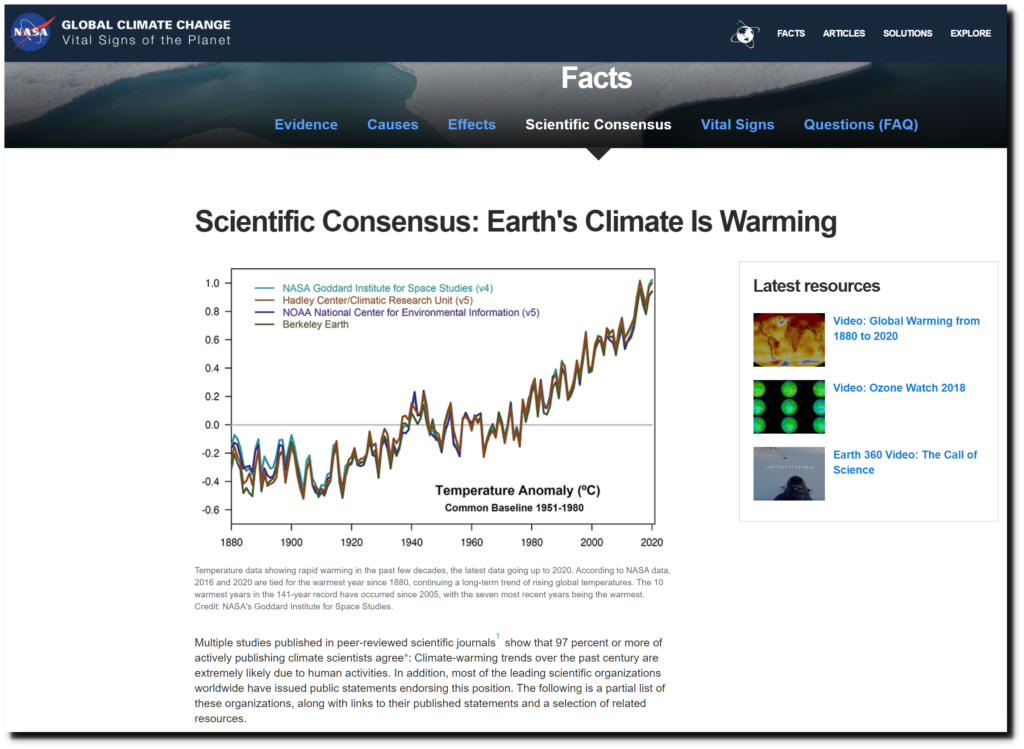
Now NASA reports 97% consensus that Earth’s climate is controlled by CO2.
Scientific Consensus | Facts – Climate Change: Vital Signs of the Planet
I agree with them – the warming trends over the last century are primarily due to human activities – data tampering by organizations like NASA and NOAA. For example, over the past 20 years NASA has turned a 70 year cooling trend in the US from 1930 to 2000 into a warming trend. This is the 1999 version.
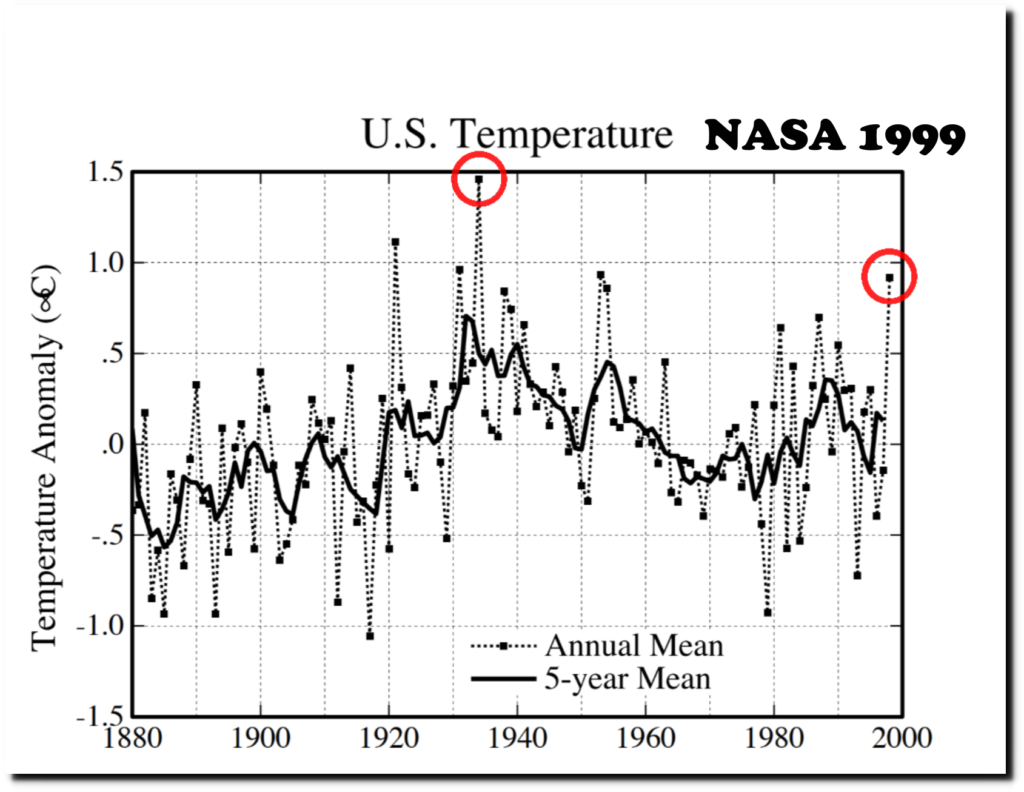
NASA 1999
And this is NASA’s current graph.
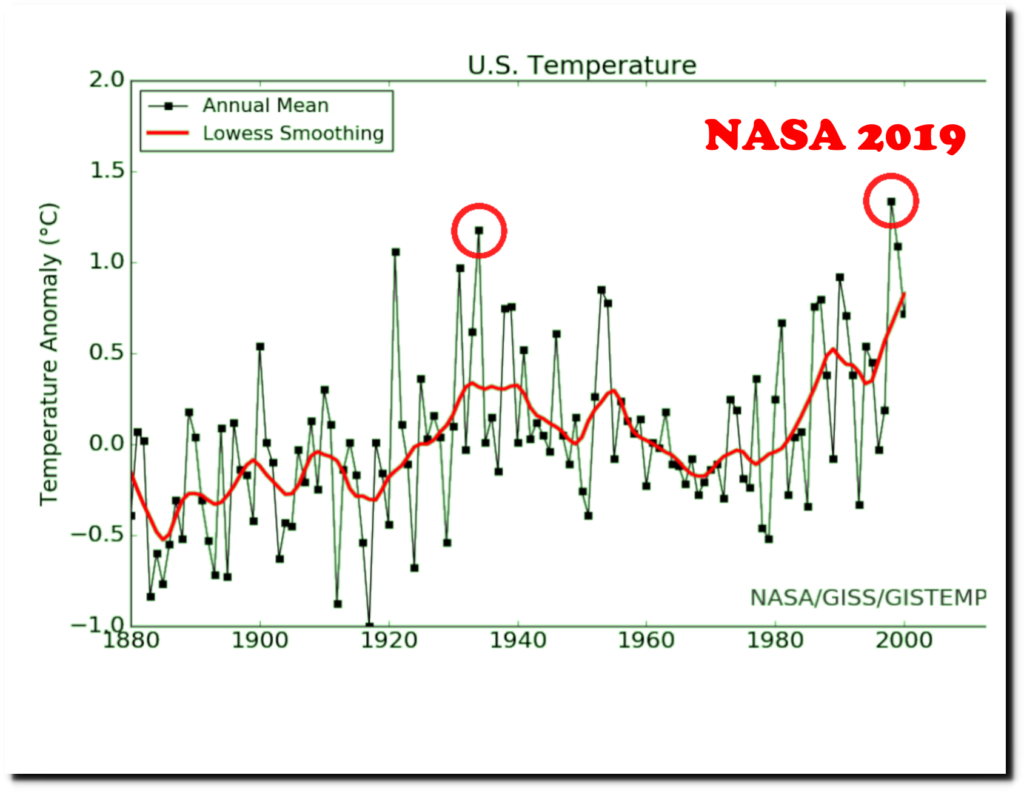
NASA 2021
Here is an animation showing how the data has been altered over the past 20 years.
LINK
=======
This is a VERY LONG post, thus worth reading as it utterly destroys warmist/alarmists lies so effectively using their own material.
It is going to entertaining to see how warmists/alarmists will be able to handle all this.

Real Climate Science
Are Government Temperature Graphs Credible?
Posted on April 7, 2021 by tonyheller
Excerpt:
Ninety years ago, the New York Times reported unanimous consensus that Earth’s climate was controlled by the sun.
TimesMachine: July 2, 1931 – NYTimes.com
Now NASA reports 97% consensus that Earth’s climate is controlled by CO2.
“Multiple studies published in peer-reviewed scientific journals show that 97 percent or more of actively publishing climate scientists agree*: Climate-warming trends over the past century are extremely likely due to human activities.”

Scientific Consensus | Facts – Climate Change: Vital Signs of the Planet
I agree with them – the warming trends over the last century are primarily due to human activities – data tampering by organizations like NASA and NOAA. For example, over the past 20 years NASA has turned a 70 year cooling trend in the US from 1930 to 2000 into a warming trend. This is the 1999 version.
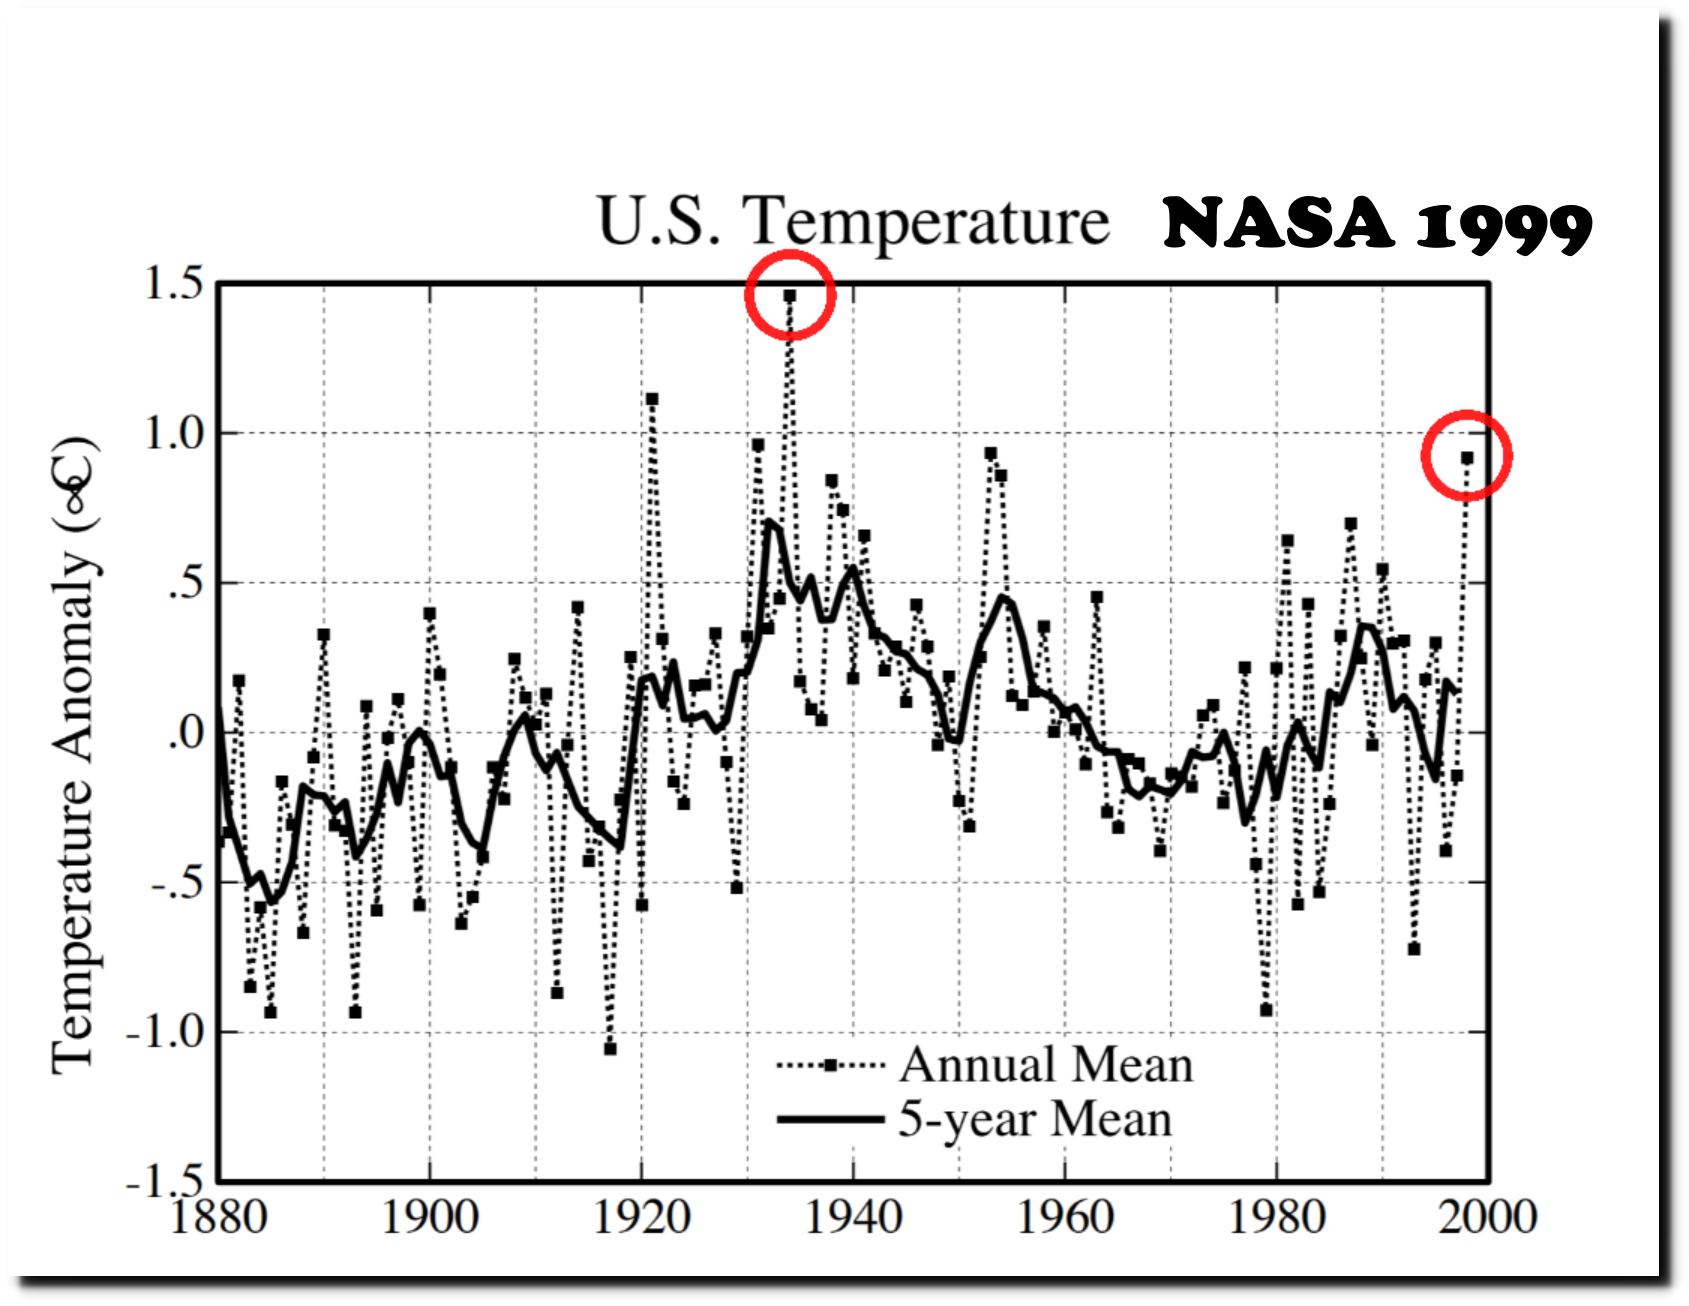
NASA 1999
And this is NASA’s current graph.
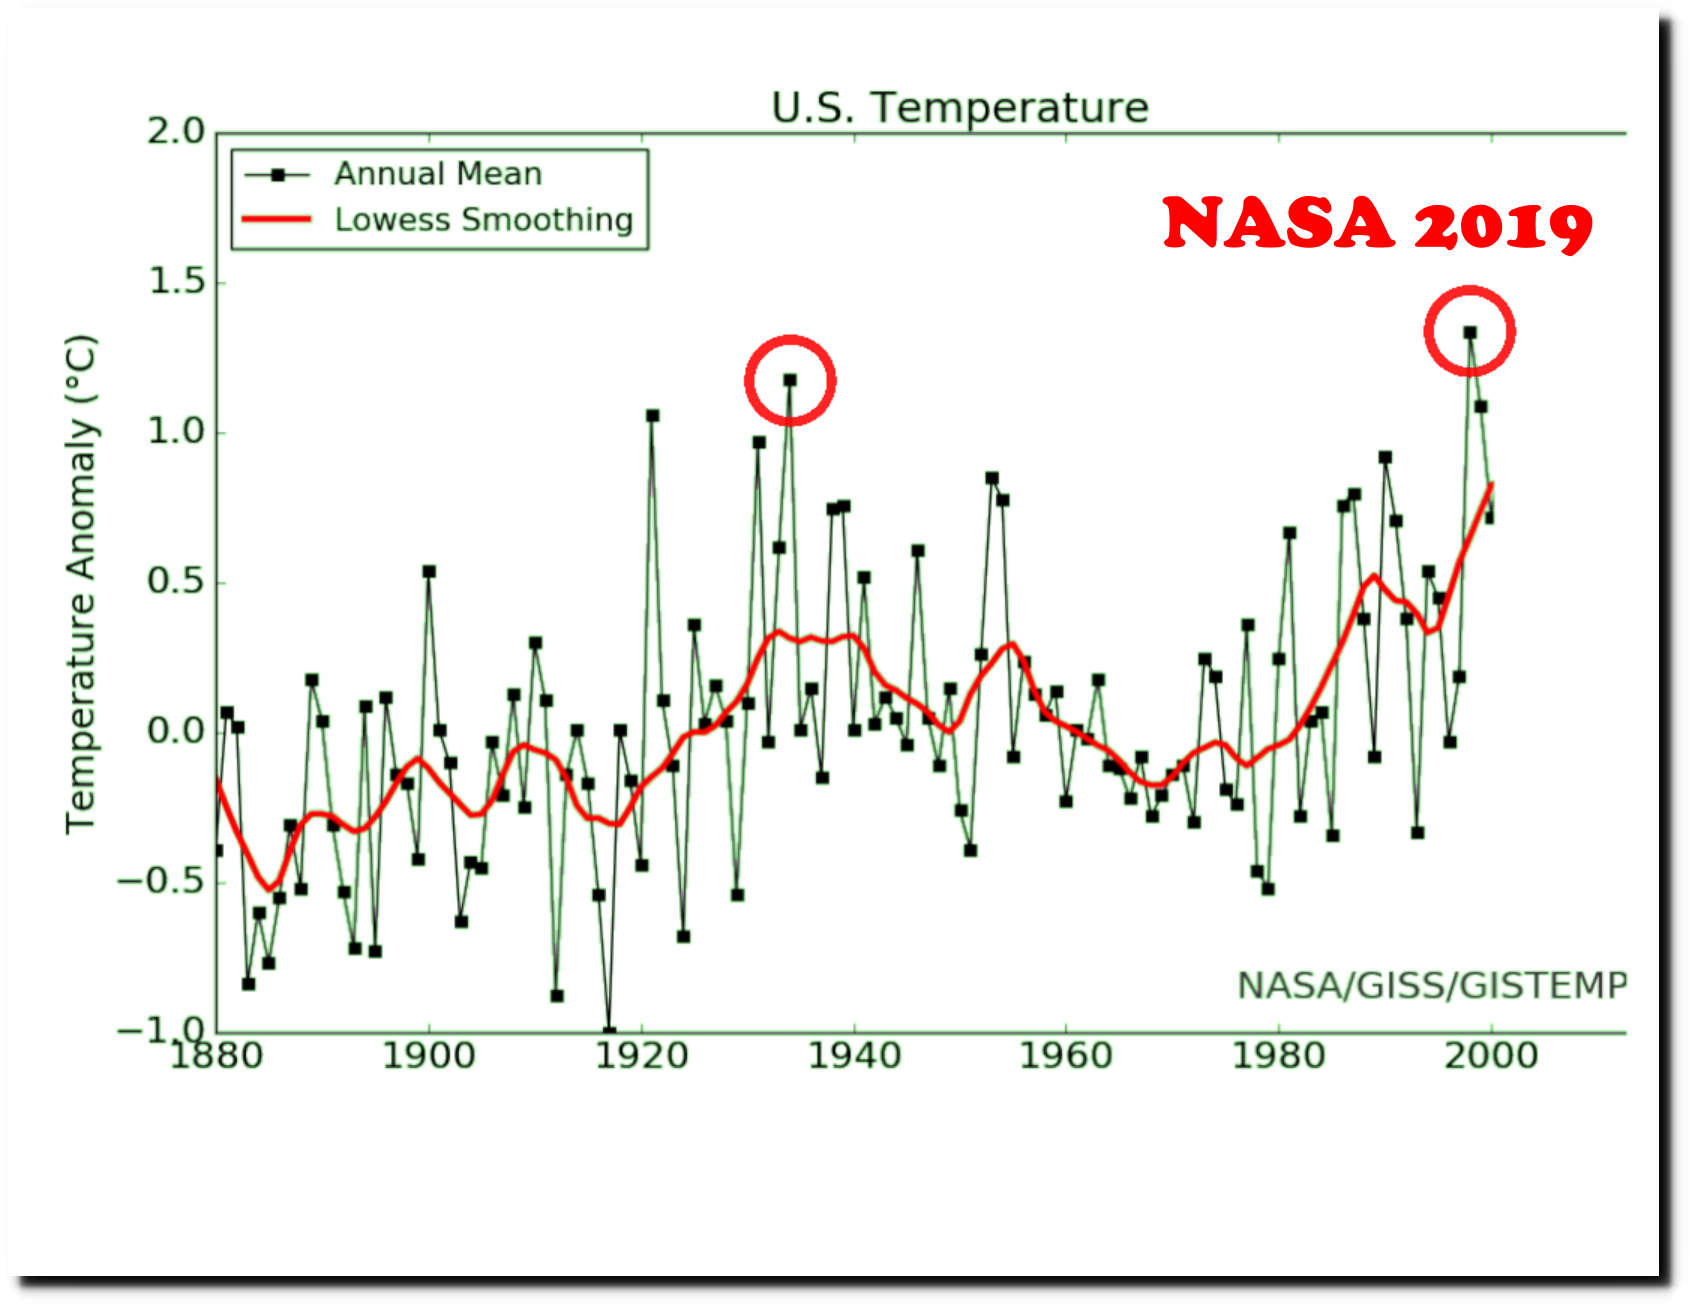
NASA 2021
Here is an animation showing how the data has been altered over the past 20 years.
LINK
=======
This is a VERY LONG post, thus worth reading as it utterly destroys warmist/alarmists lies so effectively using their own material.
It is going to entertaining to see how warmists/alarmists will be able to handle all this.