Old Rocks
Diamond Member
View image on Twitter
Follow
 Zack Labe
✔@ZLabe
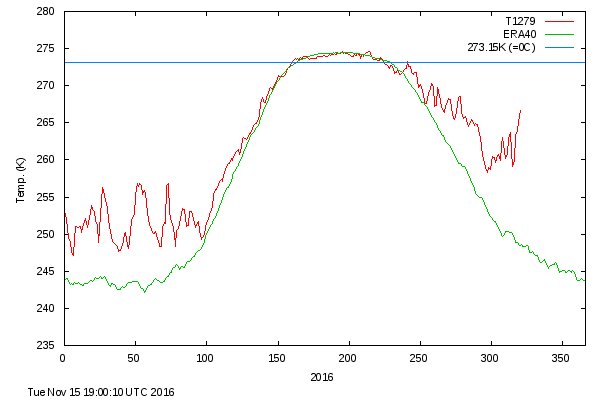
Today's latest #Arctic mean temperature continues to move the wrong direction... up. Quite an anomalous spike!
12:24 PM - 15 Nov 2016 · Irvine, CA
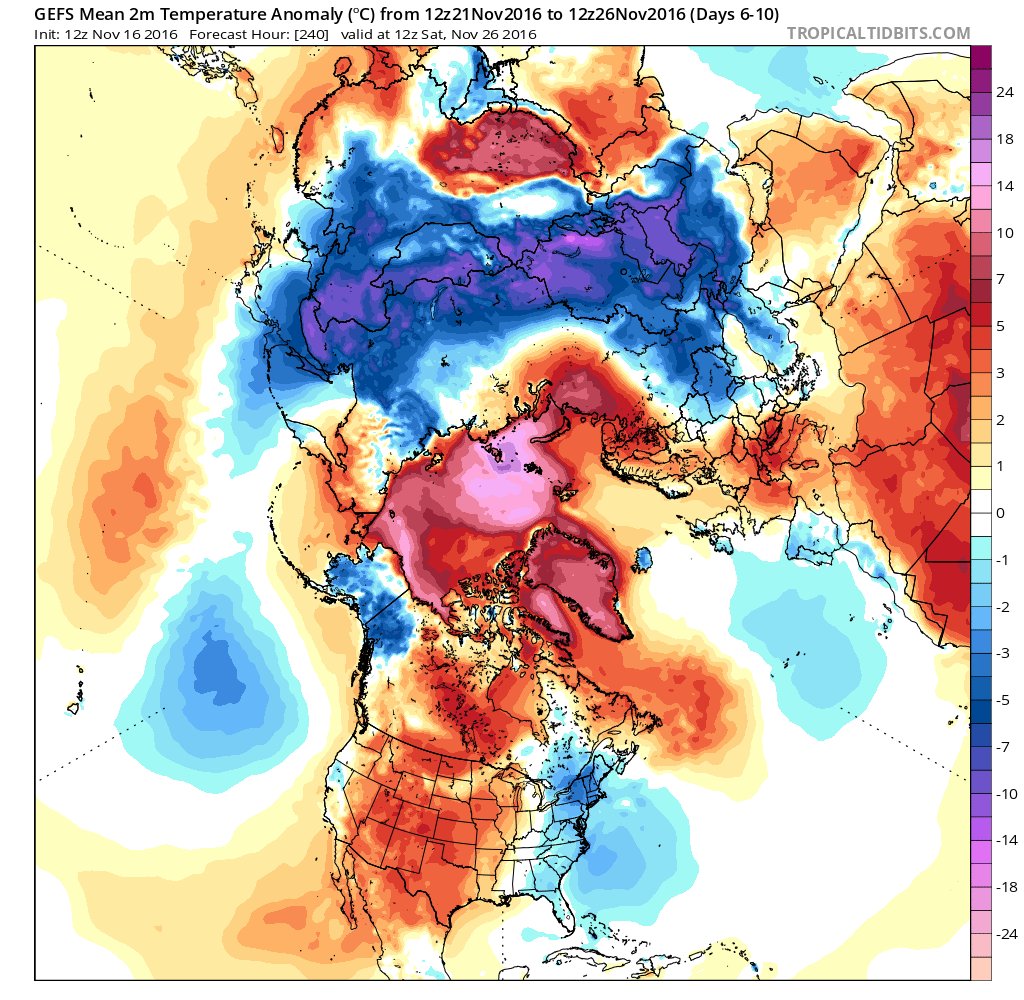
'Climate Emergency': North Pole Sees Record Temps, Melting Ice Despite Arctic Winter
"Folks, we're in a climate emergency," tweeted meteorologist Eric Holthaus.
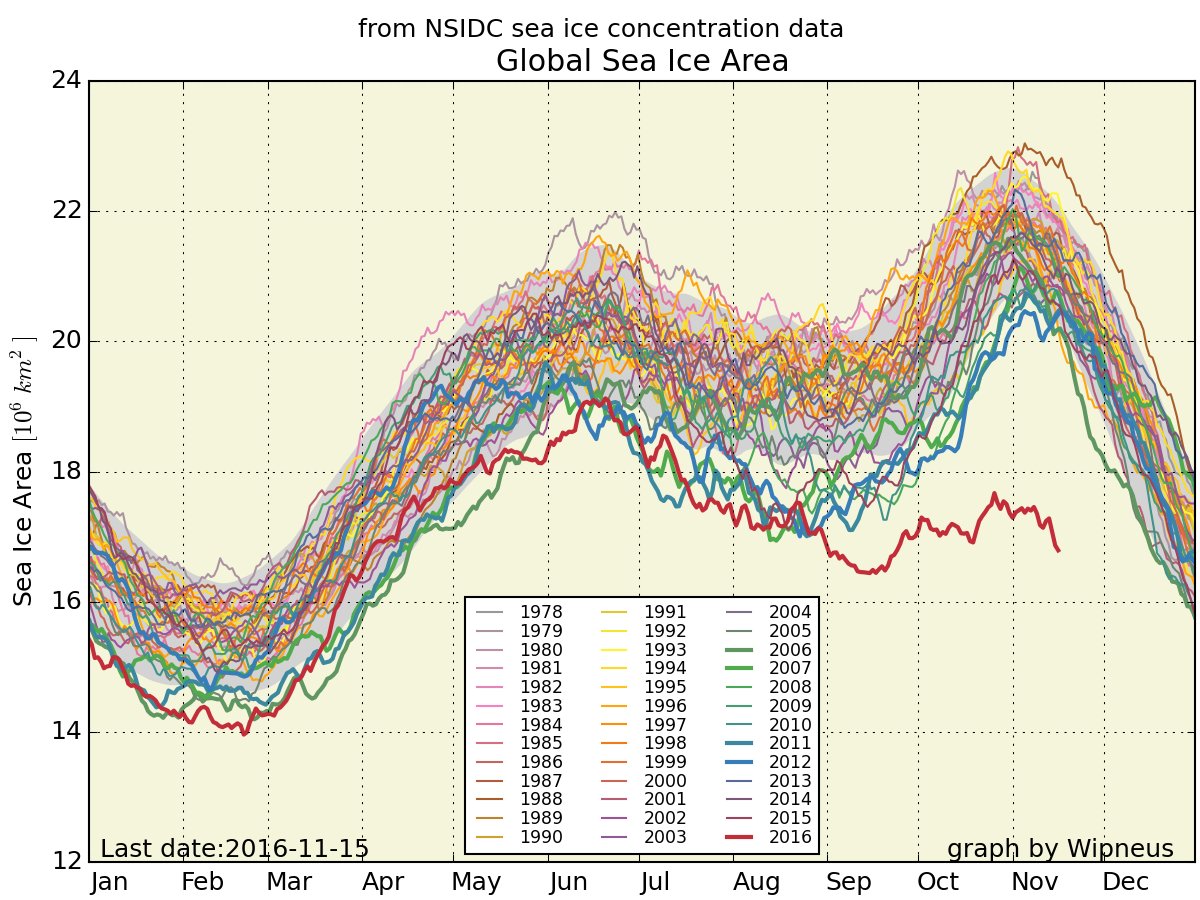
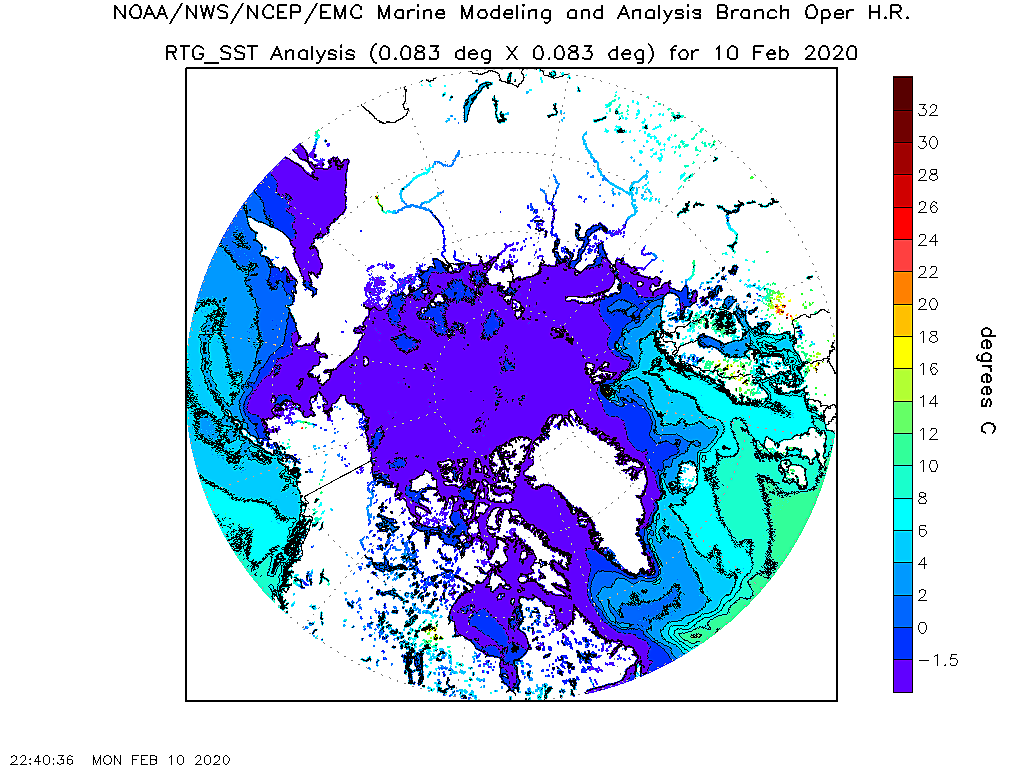
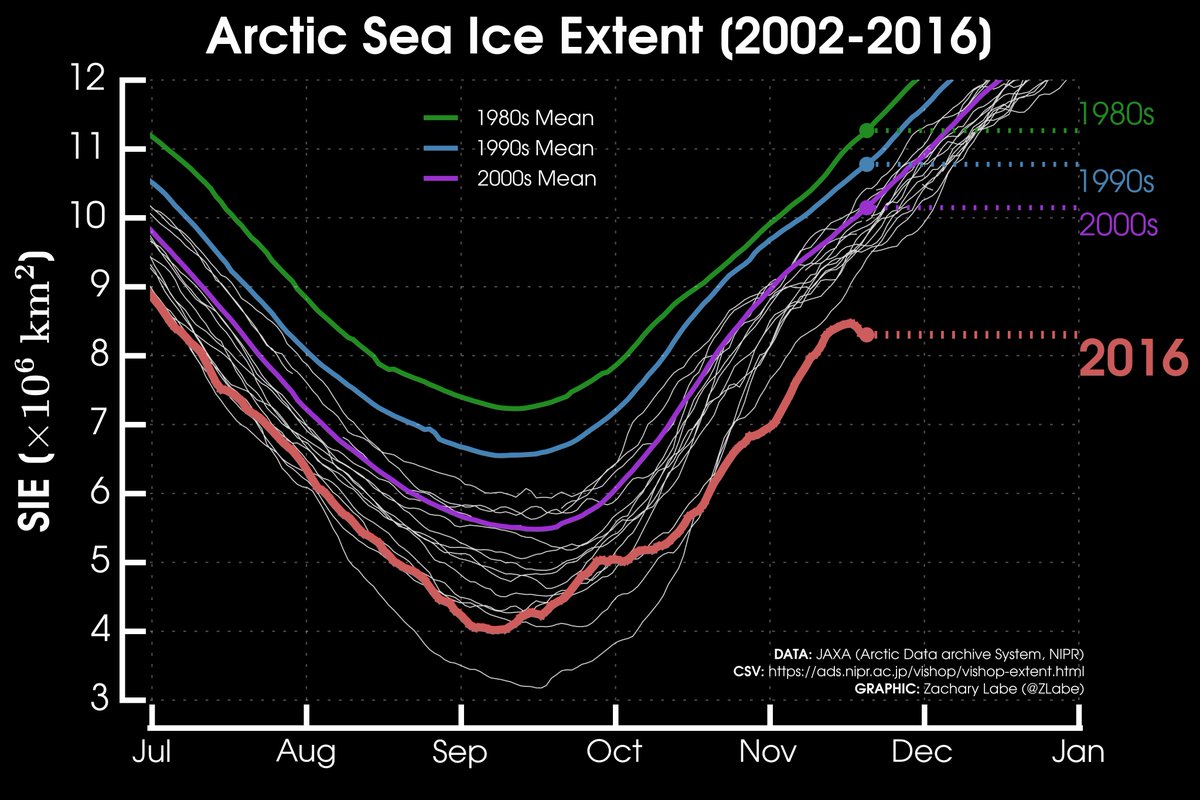
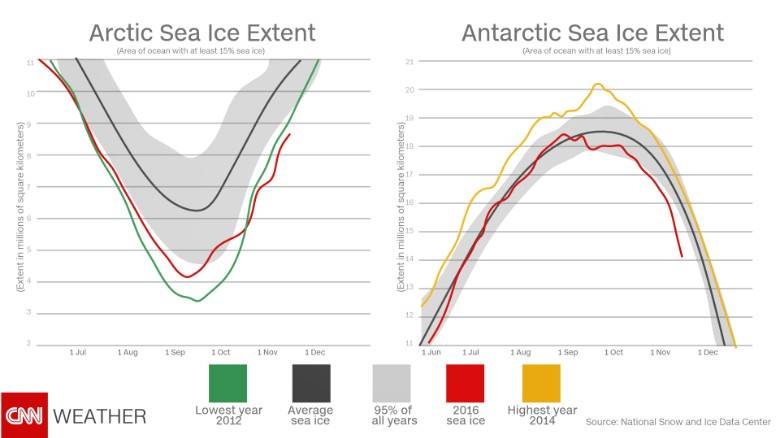
Sea ice at both poles at about three standard deviations below normal. Overall sea ice level at a major record low for this time of the year. The temperatures in the arctic way above normal. Keep a watch on this, folks, could get very interesting.
Follow
Zack Labe ✔@ZLabe
Today's latest #Arctic mean temperature continues to move the wrong direction... up. Quite an anomalous spike!
12:24 PM - 15 Nov 2016 · Irvine, CA
'Climate Emergency': North Pole Sees Record Temps, Melting Ice Despite Arctic Winter
"Folks, we're in a climate emergency," tweeted meteorologist Eric Holthaus.
Sea ice at both poles at about three standard deviations below normal. Overall sea ice level at a major record low for this time of the year. The temperatures in the arctic way above normal. Keep a watch on this, folks, could get very interesting.