What! Everything I've been reading screams about hot 2014 was the WARMEST in centuries.
So, who's right? The ever-present graphs are there to prove it but I won't be surprised when we see hundreds of other graphs saying this is wrong.
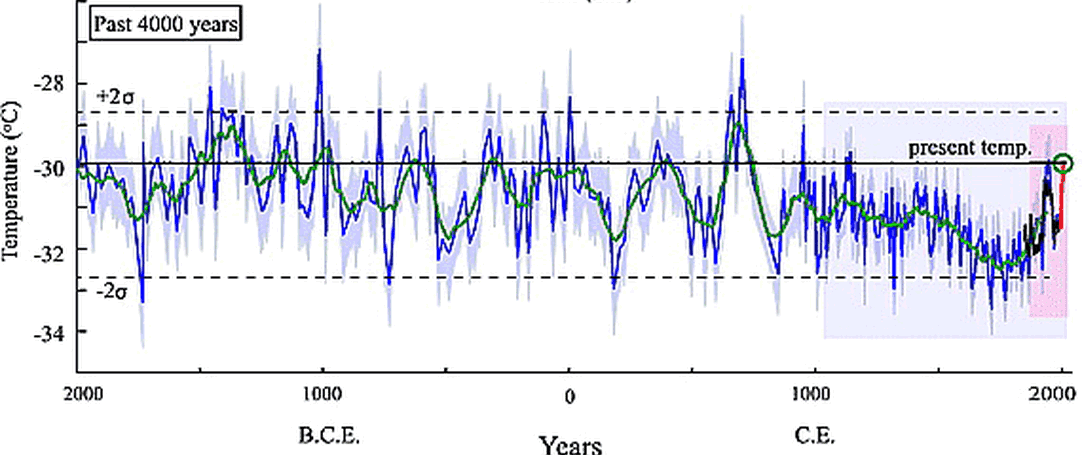
Read more @ 2014 Was One of the 3 Coldest Years in the Last 10 000 Power Line
So, who's right? The ever-present graphs are there to prove it but I won't be surprised when we see hundreds of other graphs saying this is wrong.
Read more @ 2014 Was One of the 3 Coldest Years in the Last 10 000 Power Line