What is Earth's 'correct' temperature?

Not true. There is no 10,000 year cycle for ice ages ed. The integlacials can last anywhere from 10,000-12,000 all the way to 130,000 years.
Dang you are nuts!
Really? Well, lets look at the records shall we?

Tioga Glaciation ............................12,000 BP to 25,000 Bp
Tenaya Glaciation ..........................37,000 BP
Tahoe II Glaciation.........................56,000 BP to 118,000 BP
Tahoe I Glaciation..........................131,000 BP
Sherwin Glaciation.........................760,000 BP

BP means Before Present time.
And Glaciation does NOT mean INTERGLACIAL!!! :rofl:
 
Dang you are nuts!
Really? Well, lets look at the records shall we?

Tioga Glaciation ............................12,000 BP to 25,000 Bp
Tenaya Glaciation ..........................37,000 BP
Tahoe II Glaciation.........................56,000 BP to 118,000 BP
Tahoe I Glaciation..........................131,000 BP
Sherwin Glaciation.........................760,000 BP

BP means Before Present time.
And Glaciation does NOT mean INTERGLACIAL!!! :rofl:


Uhhhh pick yourself up off the floor and calculate the time differences silly. Please show me how they happen every ten thousand years there buchwheat.

Or is grade school math beyond your abilities?
 
Last edited:
Really? Well, lets look at the records shall we?

Tioga Glaciation ............................12,000 BP to 25,000 Bp
Tenaya Glaciation ..........................37,000 BP
Tahoe II Glaciation.........................56,000 BP to 118,000 BP
Tahoe I Glaciation..........................131,000 BP
Sherwin Glaciation.........................760,000 BP

BP means Before Present time.
And Glaciation does NOT mean INTERGLACIAL!!! :rofl:
Uhhhh pick yourself up off the floor and calculate the time differences silly. Please show me how they happen every ten thousand years there buchwheat.

Or is grade school math beyond your abilities?
See for yourself

global_temp2.jpg

Image based on data from the National Oceanographic and Atmospheric Administration.
Global temperature variation for the past 425,000 years. The present is at the right. The horizontal 0 line represents the 1961–990 average global temperature. The numbers on the left show the variation from that baseline in °C.
The data were derived from an analysis of ice cores taken at the Vostok station in Antarctica.
 
Really? Well, lets look at the records shall we?

Tioga Glaciation ............................12,000 BP to 25,000 Bp
Tenaya Glaciation ..........................37,000 BP
Tahoe II Glaciation.........................56,000 BP to 118,000 BP
Tahoe I Glaciation..........................131,000 BP
Sherwin Glaciation.........................760,000 BP

BP means Before Present time.
And Glaciation does NOT mean INTERGLACIAL!!! :rofl:


Uhhhh pick yourself up off the floor and calculate the time differences silly. Please show me how they happen every ten thousand years there buchwheat.

Or is grade school math beyond your abilities?

Damn, our faux geologist once again outdoes himself!:lol:
 
Now it's sounding like humanity should WANT AGW to be true!


Ice aged suck!
Just so long as doesn't become runaway GW.


All the GW alarmists claim that we will rise by 2 degrees 5 degrees at the outside. The Roman Warming Period was a minimum of 6 degrees warmer. There was no catastrophic runaway warming. That is a fantasy designed to frighten the natives. Back millions of years ago it was far warmer and it was not a problem then either.

Come on, Walleyes. No, the Roman Warming Period was not 6 degrees warmer. There is no proof that it was even 2 degrees warmer. Also, no proof that it was anything but a regional warming.

Walleyes, Ed gives sources, I give sources, how about some valid sources for the really stupid statements that you continually make?


Poor old fraud,

Yes ed gives source as do I . Here is one of the more recent examinations of the RWP, the fact that you and yours choose to ignore solid evidence just shows how little real science concerns you all.


New technique shows Roman Warm Period Warmer than Present Day


As far as the graph shown is concerned please note the lowest estimate of the temps involved they are warmer than what would be required by themselves to initiate a glacial age. And the discussion was about a supposed 10,000 year periodicity for glaciation. Looking at the graph presented I see an approximate 60,000 year gap at around the 400,000 year mark lasting till 340,000 years BP, followed by a further near 80,000 year period etc. The interglacials appear to have around a 50,000 year cycle. But, and it's a very big but, just because the temp got low doesn't mean a ice age followed. It is a part of the puzzle but the fact remains the supposed 10,000 ice age cycle is nowhere represented in this graph.
 
Last edited:
All the GW alarmists claim that we will rise by 2 degrees 5 degrees at the outside. The Roman Warming Period was a minimum of 6 degrees warmer. There was no catastrophic runaway warming. That is a fantasy designed to frighten the natives. Back millions of years ago it was far warmer and it was not a problem then either.

Come on, Walleyes. No, the Roman Warming Period was not 6 degrees warmer. There is no proof that it was even 2 degrees warmer. Also, no proof that it was anything but a regional warming.

Walleyes, Ed gives sources, I give sources, how about some valid sources for the really stupid statements that you continually make?
Poor old fraud,

Yes ed gives source as do I . Here is one of the more recent examinations of the RWP, the fact that you and yours choose to ignore solid evidence just shows how little real science concerns you all.


New technique shows Roman Warm Period Warmer than Present Day


As far as the graph shown is concerned please note the lowest estimate of the temps involved they are warmer than what would be required by themselves to initiate a glacial age. And the discussion was about a supposed 10,000 year periodicity for glaciation. Looking at the graph presented I see an approximate 60,000 year gap at around the 400,000 year mark lasting till 340,000 years BP, followed by a further near 80,000 year period etc. The interglacials appear to have around a 50,000 year cycle. But, and it's a very big but, just because the temp got low doesn't mean a ice age followed. It is a part of the puzzle but the fact remains the supposed 10,000 ice age cycle is nowhere represented in this graph.
First of all, no where in your link does it say the globe was 6 degrees C warmer in the RWP. Secondly, they used only 26 shells of mollusks that live for only 2 to 9 years, figuring an average of 5.5 years you are talking about a coverage of less than 150 years figuring no overlap to plot 2,000 years of temperature. Obviously this "study" is full of holes, literally. :lol:

From your link:

William Patterson, lead author of the study, says that as mollusks grow the colder the water, the higher the proportion of the heavy oxygen isotope, oxygen-18 in the shells. Because shell growth depends upon seasonal temperature variations it is possible to see much finer changes than tree rings. Because they only live for between 2 – 9 years it has the potential to reveal fine temporal detail for specific periods.

The study used 26 shells obtained from sediment cores taken from an Icelandic inlet.


No problem here are some more links for you. The first is a peer reviewed study.

CO2 Science

This is a newspaper article..

EDITORIAL: Nero was hotter than Al Gore - Washington Times

There are many more if you will just have a look. You won't of course because you don't really want to know but you can start with these.


Now kindly address the problems with your graph and your supposed 10,000 year ice age cycle.

Oh and don't forget your hero Mann's hockey stick graph was based on a single tree.
 
Last edited:
Past historical evidence shows large swings in climate change. We appear to be at the tail end of an inter glacial age. I wonder if our climate research now will help us stave off the ice which is pretty surely on its way.


Ice Ages are caused by pretty complicated interrelations. The gravitational pulls of Saturn and Jupiter along with the Sun have the effect of changing the shape of our orbit. This is a critical part of the cycle. Using those forces to predict, the current interglacial should last for another 5000 or so years.

The cycle of Ice Ages and interglacials started after the continents of North and South America collided at Panama interupting then prevailing ocean currents. That part has been going on for around a million or so years.

These seem to be the two biggest factors for ice ages beginning and then cycling.
 
Last edited:
Poor old fraud,

Yes ed gives source as do I . Here is one of the more recent examinations of the RWP, the fact that you and yours choose to ignore solid evidence just shows how little real science concerns you all.


New technique shows Roman Warm Period Warmer than Present Day


As far as the graph shown is concerned please note the lowest estimate of the temps involved they are warmer than what would be required by themselves to initiate a glacial age. And the discussion was about a supposed 10,000 year periodicity for glaciation. Looking at the graph presented I see an approximate 60,000 year gap at around the 400,000 year mark lasting till 340,000 years BP, followed by a further near 80,000 year period etc. The interglacials appear to have around a 50,000 year cycle. But, and it's a very big but, just because the temp got low doesn't mean a ice age followed. It is a part of the puzzle but the fact remains the supposed 10,000 ice age cycle is nowhere represented in this graph.
First of all, no where in your link does it say the globe was 6 degrees C warmer in the RWP. Secondly, they used only 26 shells of mollusks that live for only 2 to 9 years, figuring an average of 5.5 years you are talking about a coverage of less than 150 years figuring no overlap to plot 2,000 years of temperature. Obviously this "study" is full of holes, literally. :lol:

From your link:

William Patterson, lead author of the study, says that as mollusks grow the colder the water, the higher the proportion of the heavy oxygen isotope, oxygen-18 in the shells. Because shell growth depends upon seasonal temperature variations it is possible to see much finer changes than tree rings. Because they only live for between 2 – 9 years it has the potential to reveal fine temporal detail for specific periods.

The study used 26 shells obtained from sediment cores taken from an Icelandic inlet.


No problem here are some more links for you. The first is a peer reviewed study.

CO2 Science

This is a newspaper article..

EDITORIAL: Nero was hotter than Al Gore - Washington Times

There are many more if you will just have a look. You won't of course because you don't really want to know but you can start with these.


Now kindly address the problems with your graph and your supposed 10,000 year ice age cycle.

Oh and don't forget your hero Mann's hockey stick graph was based on a single tree.

CO2 Science

What was learned
Richter et al. report that their research revealed "a general long-term cooling trend," but that "superimposed on this overall trend" were "partly higher temperatures and salinities from 180 to 560 AD and 750-1160 AD," which they say "may be ascribed to the Roman and Medieval Warm Periods, respectively," the latter of which was followed by the Little Ice Age (LIA) and what they describe as the "post-LIA recovery and, possibly, (late) 20th century anthropogenic warming."

Of this latter warming, they say that it "concurs with distinct continental-scale warming, consistently reaching unprecedented maximum temperatures after ~1990 AD." Their use of the word "unprecedented," however, is a bit misleading; for they subsequently state that "the SST increase over the last three decades does not, or not 'yet', appear unusual compared to the entire 0-2.4 ka record," and that "the warming trend over the second half of the 20th century has not yet reverted the late Holocene millennial-scale cooling." In fact, their data clearly indicate that the peak temperature of the Medieval Warm Period was approximately 2.2°C greater than the peak temperature of the late 20th century, and that the peak temperature of the Roman Warm Period was about 2.7°C greater than that of the late 20th century.

Once again, the people at this site put words into the mouths of the authors of the paper. Words and meanings that the authors would disagree with. Note also, the authors state 'continental scale'. Not global scale, as we see at present.

CO2 Science proves itself to be a bullshit site with statements like this.
 
First of all, no where in your link does it say the globe was 6 degrees C warmer in the RWP. Secondly, they used only 26 shells of mollusks that live for only 2 to 9 years, figuring an average of 5.5 years you are talking about a coverage of less than 150 years figuring no overlap to plot 2,000 years of temperature. Obviously this "study" is full of holes, literally. :lol:

From your link:


No problem here are some more links for you. The first is a peer reviewed study.

CO2 Science

This is a newspaper article..

EDITORIAL: Nero was hotter than Al Gore - Washington Times

There are many more if you will just have a look. You won't of course because you don't really want to know but you can start with these.


Now kindly address the problems with your graph and your supposed 10,000 year ice age cycle.

Oh and don't forget your hero Mann's hockey stick graph was based on a single tree.

CO2 Science

What was learned
Richter et al. report that their research revealed "a general long-term cooling trend," but that "superimposed on this overall trend" were "partly higher temperatures and salinities from 180 to 560 AD and 750-1160 AD," which they say "may be ascribed to the Roman and Medieval Warm Periods, respectively," the latter of which was followed by the Little Ice Age (LIA) and what they describe as the "post-LIA recovery and, possibly, (late) 20th century anthropogenic warming."

Of this latter warming, they say that it "concurs with distinct continental-scale warming, consistently reaching unprecedented maximum temperatures after ~1990 AD." Their use of the word "unprecedented," however, is a bit misleading; for they subsequently state that "the SST increase over the last three decades does not, or not 'yet', appear unusual compared to the entire 0-2.4 ka record," and that "the warming trend over the second half of the 20th century has not yet reverted the late Holocene millennial-scale cooling." In fact, their data clearly indicate that the peak temperature of the Medieval Warm Period was approximately 2.2°C greater than the peak temperature of the late 20th century, and that the peak temperature of the Roman Warm Period was about 2.7°C greater than that of the late 20th century.

Once again, the people at this site put words into the mouths of the authors of the paper. Words and meanings that the authors would disagree with. Note also, the authors state 'continental scale'. Not global scale, as we see at present.

CO2 Science proves itself to be a bullshit site with statements like this.
Exactly, there is a big difference between what is in quotation marks and what the deniers have added.
 
See for yourself

global_temp2.jpg

Image based on data from the National Oceanographic and Atmospheric Administration.
Global temperature variation for the past 425,000 years. The present is at the right. The horizontal 0 line represents the 1961–990 average global temperature. The numbers on the left show the variation from that baseline in °C.
The data were derived from an analysis of ice cores taken at the Vostok station in Antarctica.
Wow. I didn't know there were American SUVs around 425,000 years ago. :eek:
 
Poor old fraud,

Yes ed gives source as do I . Here is one of the more recent examinations of the RWP, the fact that you and yours choose to ignore solid evidence just shows how little real science concerns you all.


New technique shows Roman Warm Period Warmer than Present Day


As far as the graph shown is concerned please note the lowest estimate of the temps involved they are warmer than what would be required by themselves to initiate a glacial age. And the discussion was about a supposed 10,000 year periodicity for glaciation. Looking at the graph presented I see an approximate 60,000 year gap at around the 400,000 year mark lasting till 340,000 years BP, followed by a further near 80,000 year period etc. The interglacials appear to have around a 50,000 year cycle. But, and it's a very big but, just because the temp got low doesn't mean a ice age followed. It is a part of the puzzle but the fact remains the supposed 10,000 ice age cycle is nowhere represented in this graph.
First of all, no where in your link does it say the globe was 6 degrees C warmer in the RWP. Secondly, they used only 26 shells of mollusks that live for only 2 to 9 years, figuring an average of 5.5 years you are talking about a coverage of less than 150 years figuring no overlap to plot 2,000 years of temperature. Obviously this "study" is full of holes, literally. :lol:

From your link:

William Patterson, lead author of the study, says that as mollusks grow the colder the water, the higher the proportion of the heavy oxygen isotope, oxygen-18 in the shells. Because shell growth depends upon seasonal temperature variations it is possible to see much finer changes than tree rings. Because they only live for between 2 – 9 years it has the potential to reveal fine temporal detail for specific periods.

The study used 26 shells obtained from sediment cores taken from an Icelandic inlet.


No problem here are some more links for you. The first is a peer reviewed study.

CO2 Science

This is a newspaper article..

EDITORIAL: Nero was hotter than Al Gore - Washington Times

There are many more if you will just have a look. You won't of course because you don't really want to know but you can start with these.


Now kindly address the problems with your graph and your supposed 10,000 year ice age cycle.

Oh and don't forget your hero Mann's hockey stick graph was based on a single tree.
Old Rocks beat me to debunking your first link, I would only add the the opinion piece you linked to was not peer reviewed. You did not link to the peer reviewed study.

And the Washington Slimes is a right wing propaganda rag that has no credibility. They have been lying about Gore since the 1990s.

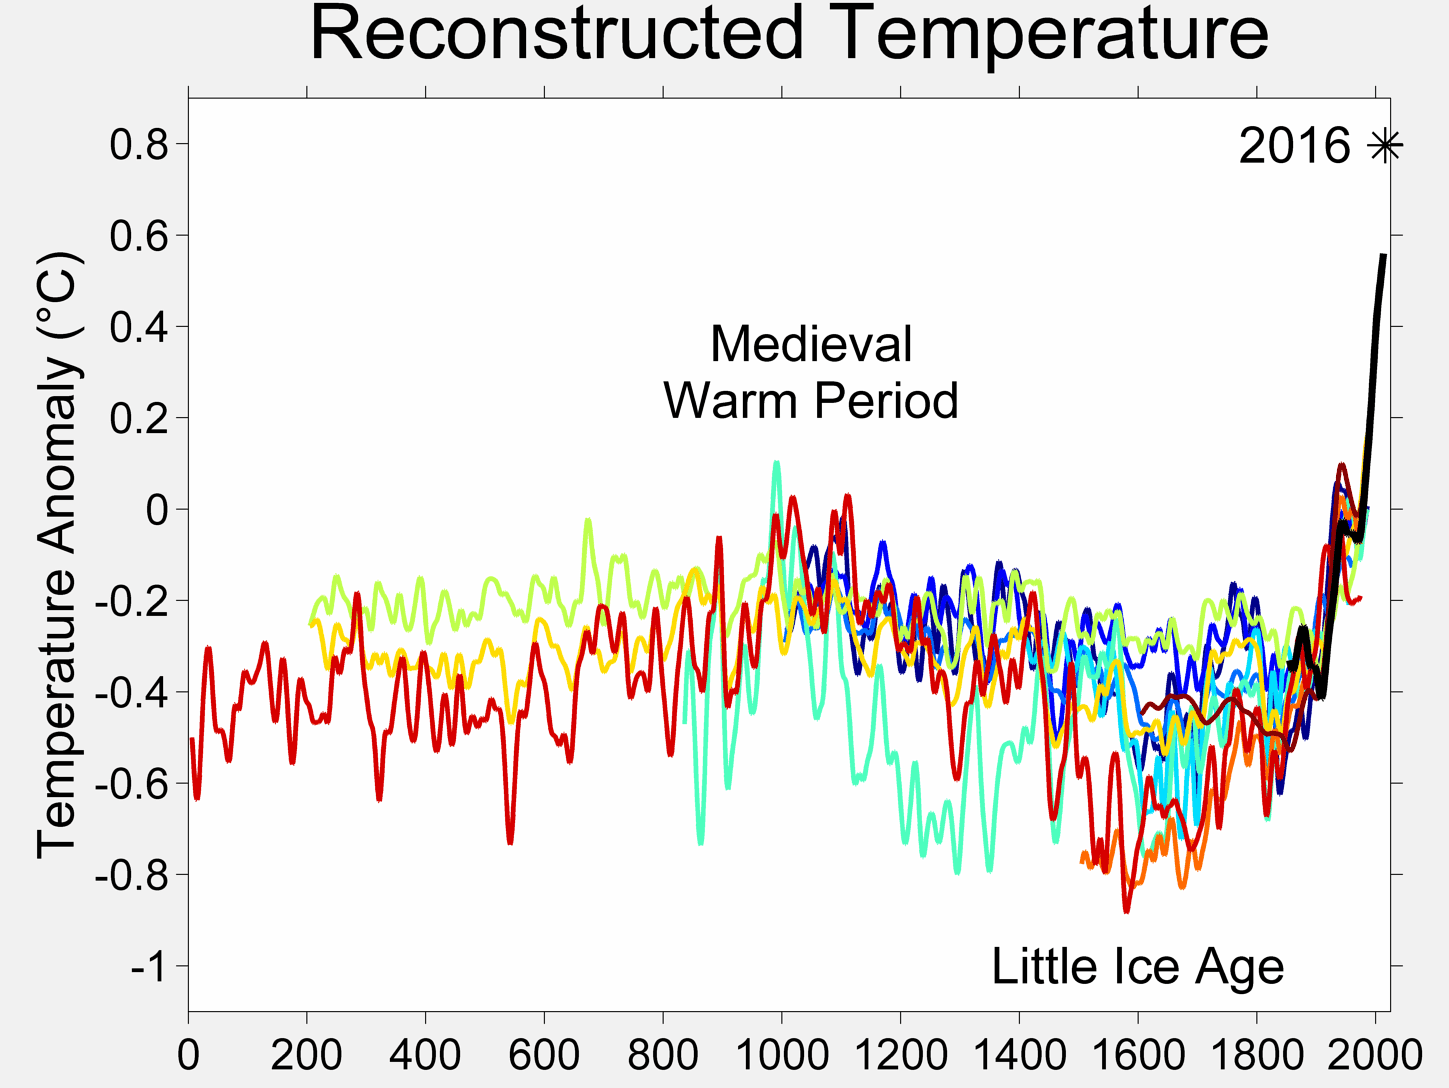
And the graph I posted was not in any way based on a single tree!!!
Each one of the colored lines uses a different method of collecting proxy data and the thick black line is from direct instrument measurement.

2000_Year_Temperature_Comparison.png
 
Last edited:
2000_Year_Temperature_Comparison.png


Ooh, scary! :eek:


Wait, you posted something else, too


global_temp2.jpg


Well, in the grand scheme of things, we seem to fit right in with the pattern, now don't we?


Wow fancy that! Someone else understands the basics too! There are so many more of us now that the real information is getting out.
 
How have we arrived at a "crisis" in our weather by studying the temperature changes at the surface of the planet? The atmosphere is an ocean twenty miles deep, can you predict the effect on the entire system by noting fluctuations only on the bottom? Can you claim you understand a constantly changing adjusting compensating system? Get real. Pappadave
 
How have we arrived at a "crisis" in our weather by studying the temperature changes at the surface of the planet? The atmosphere is an ocean twenty miles deep, can you predict the effect on the entire system by noting fluctuations only on the bottom? Can you claim you understand a constantly changing adjusting compensating system? Get real. Pappadave

Who says they're only testing the bottom? Sounds like you need to do some research before posting.
 

Forum List

Back
Top