Welcome to the Adjustocene

paintimage5267.jpg


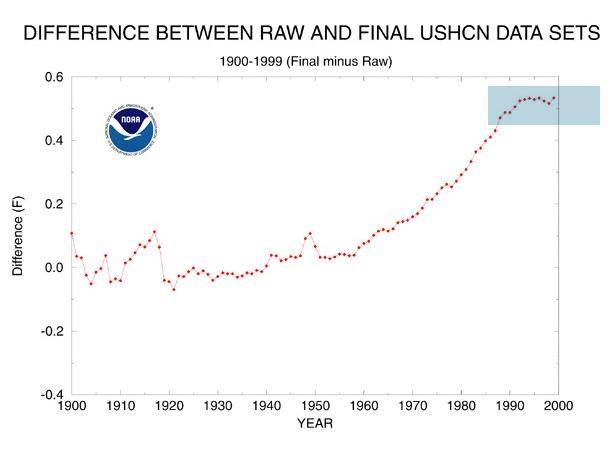
adjustments for the US up to 2000. nearly 0.6F, basically all the US warming as declared in 2000.

image023.jpg


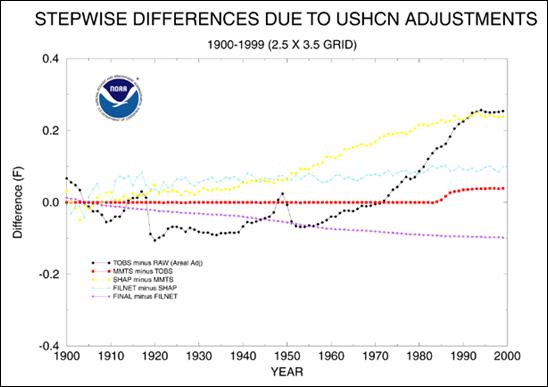
a breakdown of the adjustments. time of observation bias is 0.3F, half of all adjustments, as of 2000

hansen60.gif


here is the original sighting of the Y2K bug. an extra 1.0C adjustment for TOBS. this type of adjustment log was available at GISS until they switched to v.3.

tbc
 
BTW, there were already quality control programs in place that were supposed to catch large jumps in the temperature records. how a 1C jump in 1/5 to 1/3 of all US stations, all at the same time, went unnoticed doesnt really add confidence in the infallibility of experts.
 
I posted 2 "GW safe" places to move in a thread from 2012 --- Places where Global Warming doesn't exist..

Would love to see how Gloversville, NY looks in the Adjustocene Era today..


here is GISS v.2 raw

station.gif


GISS v.3 homogemized. NB the change in the y axis scale

station.gif


BEST graph and table

38814-TAVG-Comparison.png

Mean Rate of Change ( °C / Century )
Raw monthly anomalies 0.86
After quality control 0.91
After breakpoint alignment 0.79
Regional expectation during same months 0.85 ± 0.14
National average during same months 0.67 ± 0.13
Global land average during same months 0.78 ± 0.07


and the actual raw data (supposedly) with separate adjustments-
http://berkeleyearth.lbl.gov/auto/Stations/TAVG/Text/38814-TAVG-Data.txt

that you could compare to the GISS raw data (supposedly) -
http://data.giss.nasa.gov/tmp/gistemp/STATIONS/tmp_425725180040_0_0/station.txt


enjoy!

Just as fast as you post many of your graphs they disappear.. I keep getting "not found" errors when following links to original graphs.


the GISS graphs almost always disappear after a few hours or days. sorry about that but it is a function of their website.

Must be the same contractors that built the ObamaCare website huh ??
 

Forum List

Back
Top