Watching the sea ice melt in the arctic 2012!

ScienceRocks

Democrat all the way!
Mar 16, 2010
59,455
6,793
1,900
The Good insane United states of America
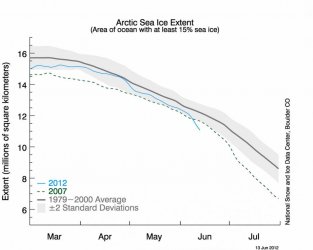
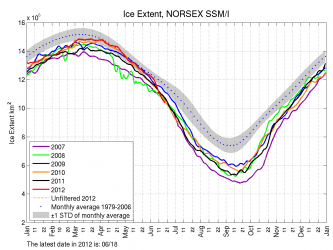
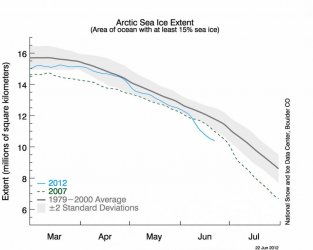
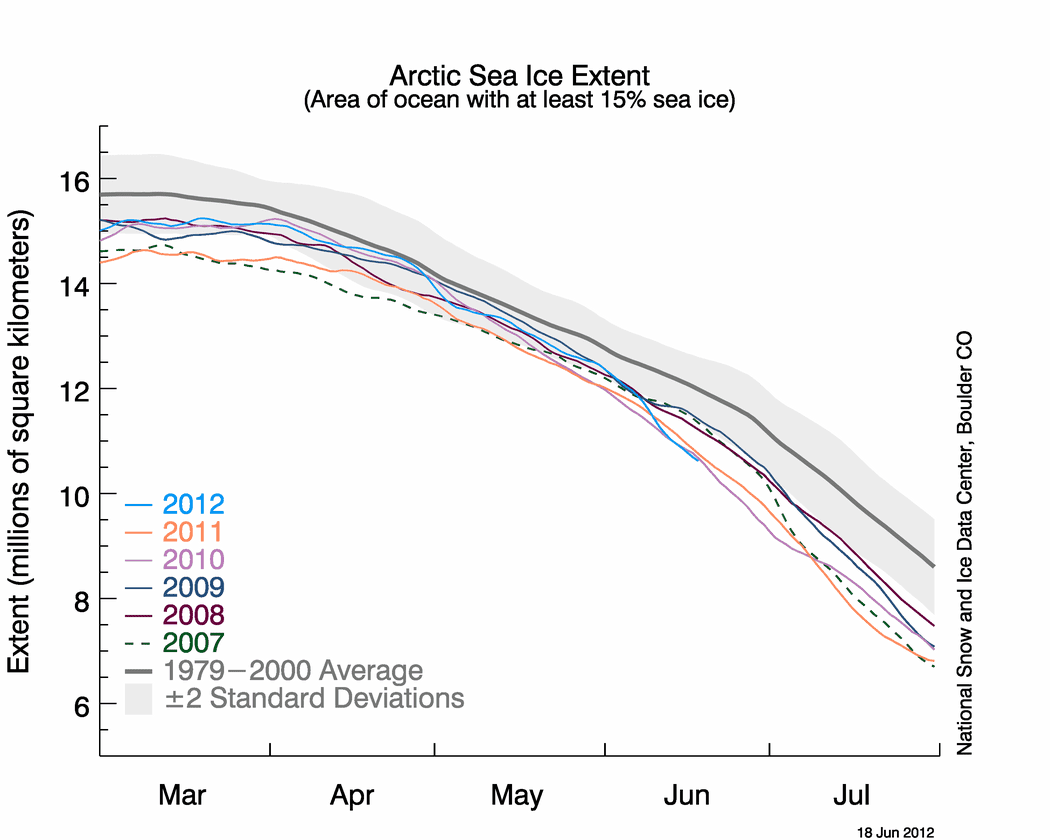
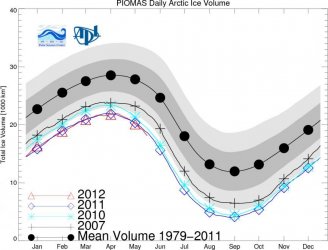
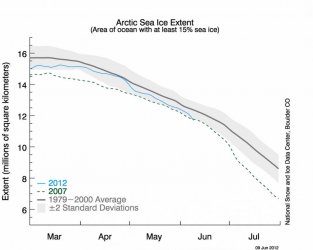
As of June 10th the volume is at record low levels and the area has just want below 2007!

We will be discussing the race for the record in this thread! What's even more AMAZING is the fact that we were almost to avg this winter!

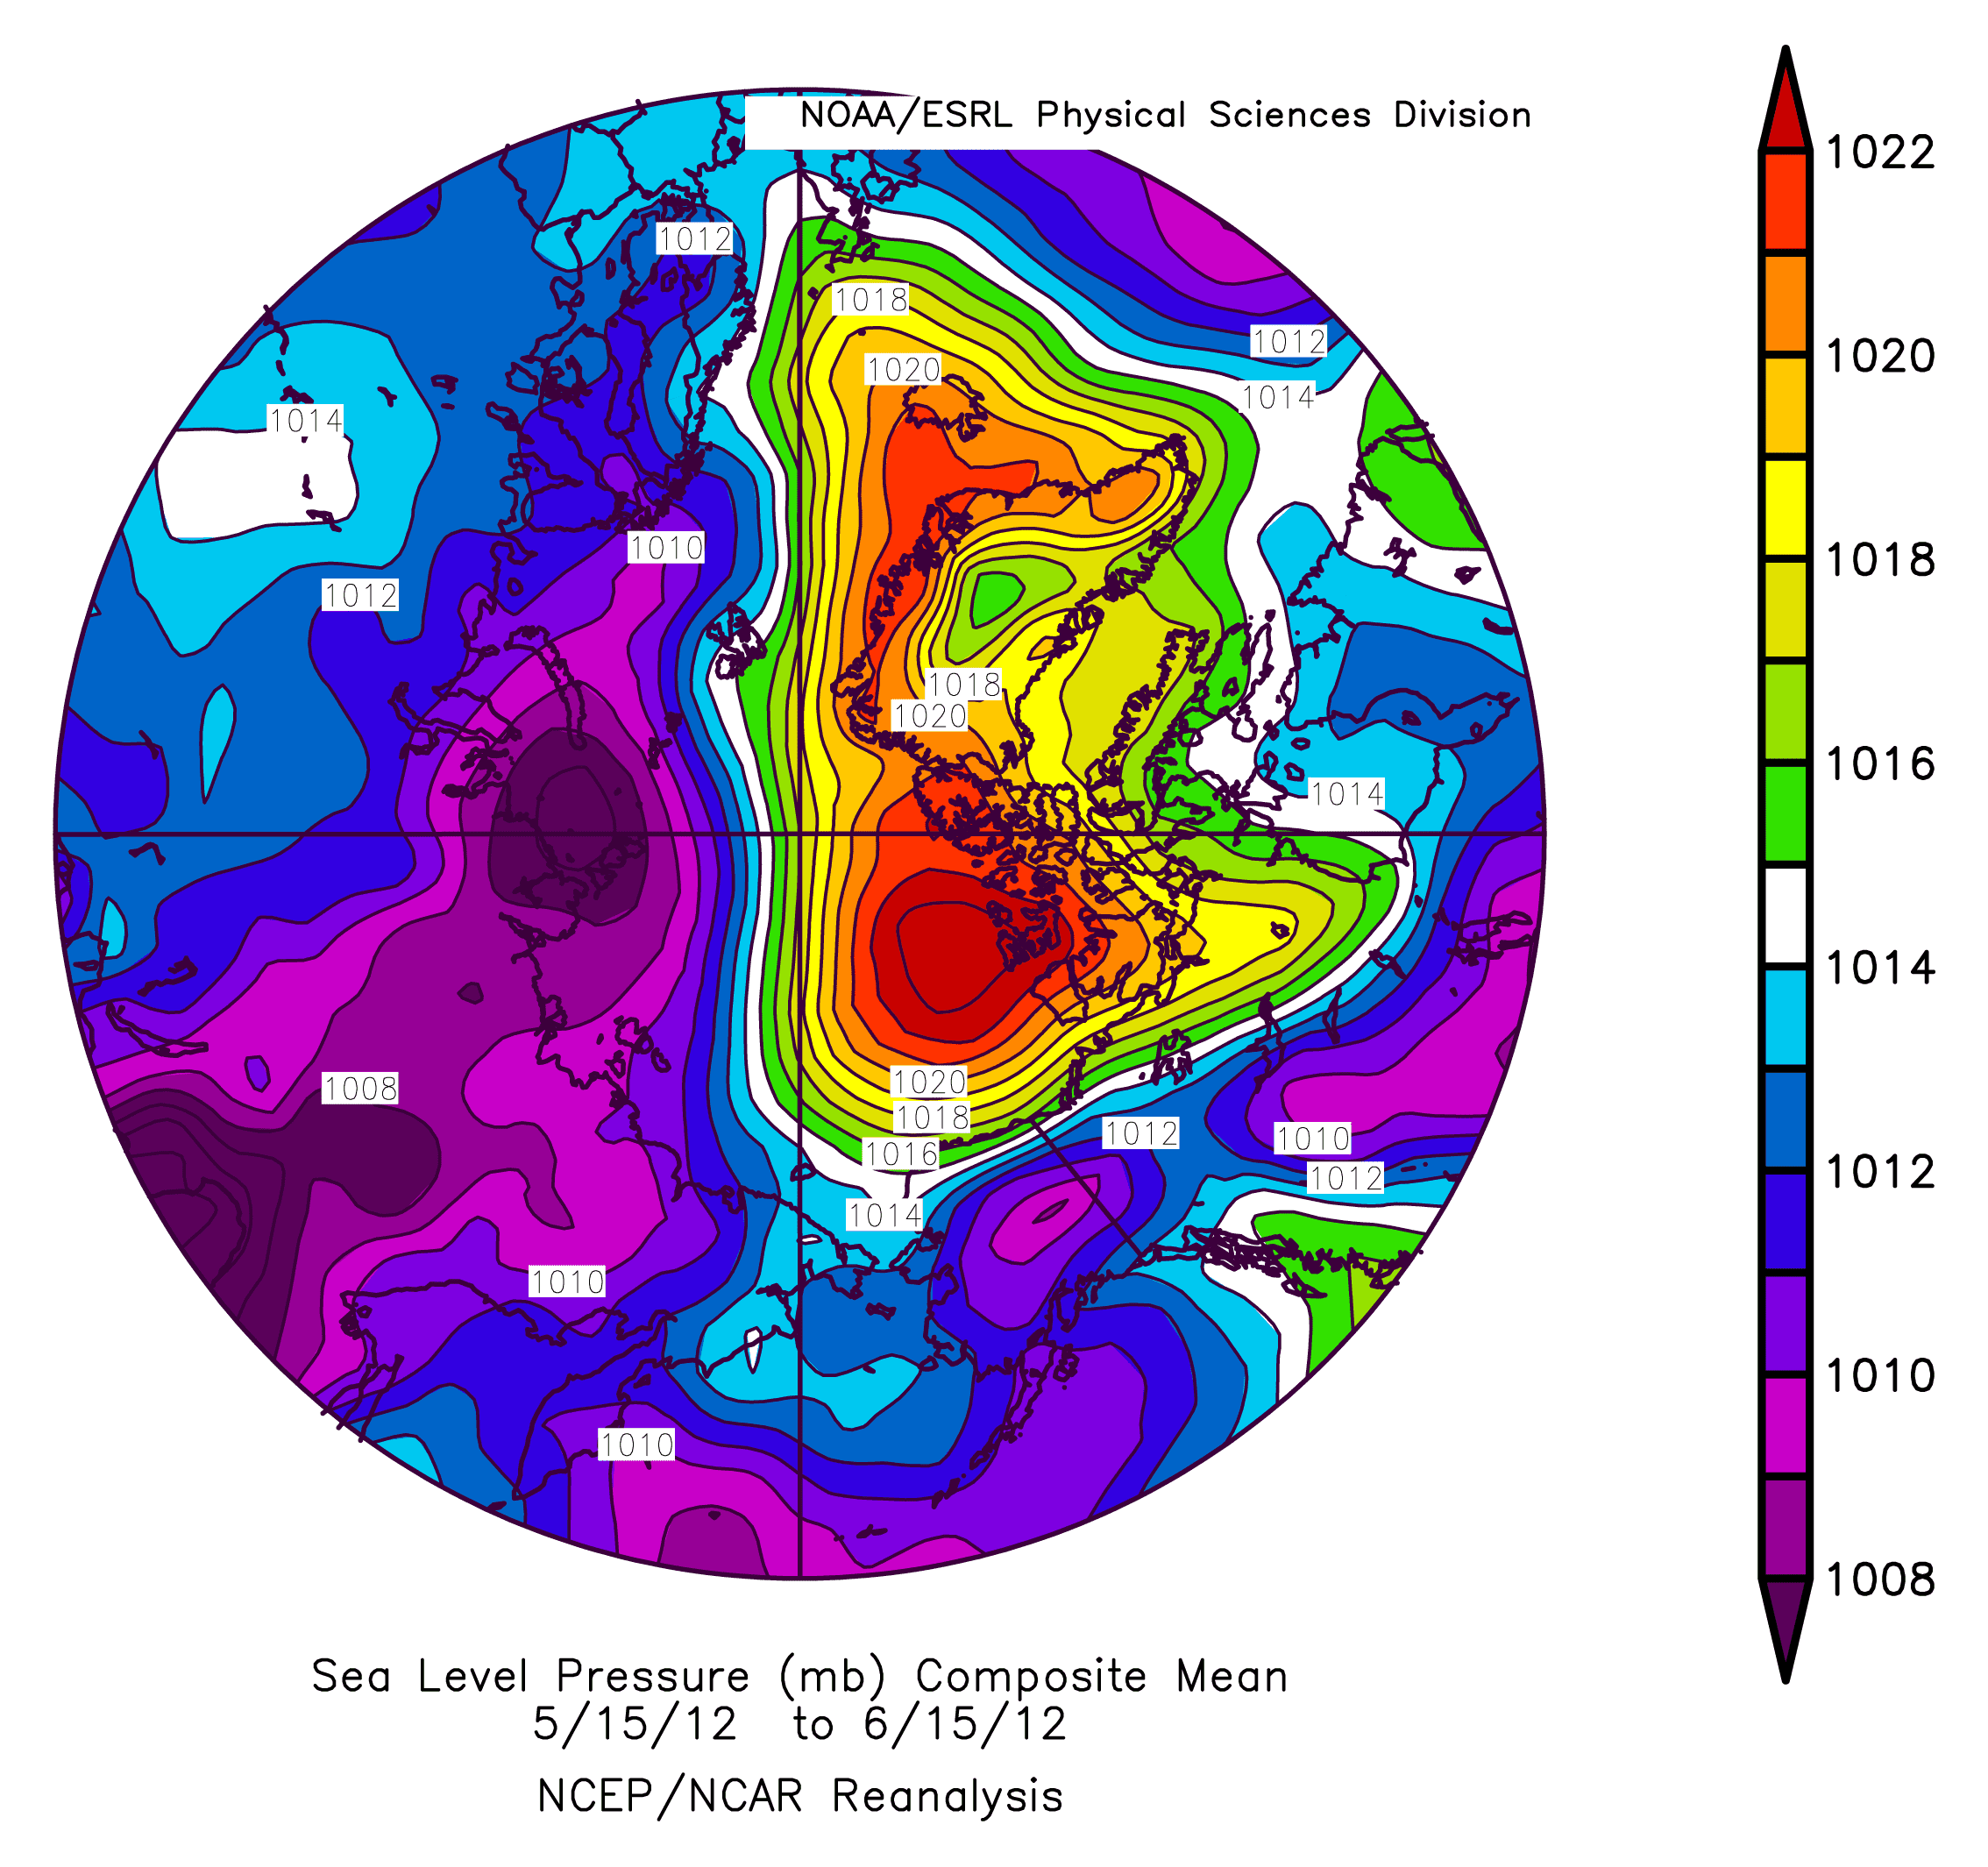
Weather patterns are everything this year like the last 4 years as that will tell where we end up! If we see a strong ridge(arctic dipole) like 2007 that lasts through the season...Well, this will easly become number one, but if we see 3-5 weeks of low pressure like 2010, 2011 in the heart of the melt season we may end up in 2 or 3rd place.
 

Attachments

  • $BPIOMASIceVolumeAnomalyCurrentV2_CY.jpg
    $BPIOMASIceVolumeAnomalyCurrentV2_CY.jpg
    61.2 KB · Views: 129
  • $N_stddev_timeseries.jpg
    $N_stddev_timeseries.jpg
    49.4 KB · Views: 143
Last edited:


But the "increase" is insignificant, only to the real hyper-believers. Getting selective about what to get angst over has done major damage to the efforts of the warming crowd...........appears very disingenuous............which in the bigger picture has turned out to be "significant".


But the "increase" is insignificant, only to the real hyper-believers. Getting selective about what to get angst over has done major damage to the efforts of the warming crowd...........appears very disingenuous............which in the bigger picture has turned out to be "significant".

Higher temperature=higher evaporation rate(more water vapor)=more precipitation. At least over and near Antarctica. Dry air holds far less precipable water than warmer air does.


On a warming earth these very cold places would see a increase in snow. :eek: 
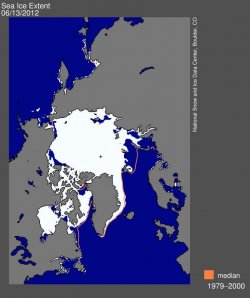
Also one of the reasons why we seen such a huge extent of "sea ice" (arctic) based on satellite this winter is because of extra snow falling on it. Even through the volume is at its lowest volume ever! More snow reflects and makes it look that way...

A airmass of 20f holds far more water then -20f to reach the dew point to condense into clouds.


---
How this year will rank has 100 percent to DO with weather pattern. If we have the same pattern as 2007 this year, we will get into the 3,500,000-3,900,000's for extent...

We were within a week of melting last year of beating 2007...If we had 2 weeks instead of 3 weeks of crappy melting(clouds, low pressure) in August last year...We would been discussing 2011 as the record.

Understand a perfect high pressure(arctic dipole) like 2007 is likely every 15-20 year event.
 
Last edited:
PIOMAS June 2012 - Arctic Sea Ice

Average thickness for May 31st (in m):
•2005: 2.33
•2006: 2.31
•2007: 2.16
•2008: 2.29
•2009: 2.14
•2010: 1.95
•2011: 1.86
•2012: 1.82

According to the model sea ice volume hasn't been as low on May 31st as this year. It looks like we're seeing the same crash as in 2010 and 2011, but right now 2012 is 562 km3 lower than 2011, and 1262 km3 lower than 2010.
 
While the ice curve has been very lumpy this year, the direction of that curve right now is not good;

Northern Hemisphere Sea Ice Area

2011 had 3 weeks of shitty malt(low pressure) in July into August than again a early end of the melt season. Well, 2011 almost beat 2007 coming within 100,000 of doing so.

2012 has less volume than 2011...We see the same shitty patterns as 2010-2011 we will do it. IF WE SEE patterns coming close to 2007 we will destroy the RECORD.
 
Nearly a million KM below 2007 right now! Will be up to the pattern(weather set up) to give us the record or not...We came within 1 decent day in July(100,000 km^3) of beating 2007 last year. Easier this year!
 

Attachments

  • $N_stddev_timeseri.jpg
    $N_stddev_timeseri.jpg
    49.6 KB · Views: 101
  • $N_daily_e.jpg
    $N_daily_e.jpg
    58.9 KB · Views: 65
Last edited:
Well, remaining well below 2007. Close to 2010, 2011. It really is all going to lay on the weather pattern throughout the next 3 months. The second map shows temperature anomalies. A good pattern for melting on the Canada side...
 

Attachments

  • $N_stddev_timeseries23.jpg
    $N_stddev_timeseries23.jpg
    50 KB · Views: 58
  • $12zGFS1-5day850mbTempAnomalyNA-1.gif
    $12zGFS1-5day850mbTempAnomalyNA-1.gif
    63.9 KB · Views: 59
Last edited:
All that melting sea ice will freeze in the next Ice Age. I feel bad for the mastodon.
 
Arctic Sea Ice News and Analysis

Jun 19, 2012

Sea ice tracking at record low levels

Analysis

After a period of rapid ice loss through the first half of June, sea ice extent is now slightly below 2010 levels, the previous record low at this time of year. Sea level pressure patterns have been favorable for the retreat of sea ice for much of the past month.
20120619_Figure2.png


Figure 1. Arctic sea ice extent for 18 June 2012 (left) was 10.62 million square kilometers (4.10 million square miles), 31,000 square kilometers (12,000 square miles) below the same day in 2010 (right). The orange line shows the 1979 to 2000 median extent for that month. The black cross indicates the geographic North Pole. Sea Ice Index data. About the data

Credit: National Snow and Ice Data Center
High-resolution images: Figure 1a, Figure 1b


Overview of conditions

On June 18, the five-day average sea ice extent was 10.62 million square kilometers (4.10 million square miles). This was 31,000 square kilometers (12,000 square miles) below the same day in 2010, the record low for the day and 824,000 square kilometers (318,000 square miles) below the same day in 2007, the year of record low September extent.


Figure 2. The graph above shows Arctic sea ice extent as of June 18, 2012, along with daily ice extent data for the previous four years. 2012 is shown in blue, 2011 in orange, 2010 in pink, 2009 in navy, 2008 in purple, and 2007 in green. The gray area around the average line shows the two standard deviation range of the data. Sea Ice Index data.

Credit: National Snow and Ice Data Center
High-resolution image


Conditions in context

The main contributors to the unusually rapid ice loss to this point in June are the disappearance of most of the winter sea ice in the Bering Sea, rapid ice loss in the Barents and Kara Seas, and early development of open water areas in the Beaufort and Laptev Seas north of Alaska and Siberia. Recent ice loss rates have been 100,000 to 150,000 square kilometers (38,600 to 57,900 square miles) per day, which is more than double the climatological rate.

20120618_Figure3.png


Figure 3: This map of mean sea level pressure from 15 May 2012 to 15 June 2012 shows a pattern of high pressure over the Beaufort Sea and a pattern of low pressure over the Laptev Sea, conditions favorable to summer ice loss.

Credit: NSIDC courtesy NOAA/ESRL PSD
High-resolution image

Sea level pressure favors the advection of ice

A pattern of high pressure over the Beaufort Sea and low pressure over the Laptev Sea has been present for the past few weeks. This pattern is favorable for summer ice loss, by advecting warm winds from the south (in eastern Asia) to melt the ice and transport it away from the coastlines in Siberia and Alaska. The high pressure over the Beaufort leads to generally clear skies, and temperatures are now above freezing over much of the Arctic pack. Snow cover in the far north is nearly gone, earlier than normal, allowing the coastal land to warm faster.

Early melt onset, and clear skies near the solstice are favorable conditions for more rapid melting, and warming of the ocean in open-water areas. The persistence of this type of pressure pattern throughout summer 2007 was a major factor toward causing the record low September extent that year. Conversely, in 2010, the patterns were not as favorable for loss of ice and the seasonal decline slowed later in the summer, and the extent did not approach the record low levels of 2007.

While these patterns and conditions have looked similar to 2007, over the last couple days the high pressure pattern over the Beaufort Sea has broken down. And while the extent is at a record low for the date, it is still early in the melt season. Changing weather patterns throughout the summer will affect the exact trajectory of the sea ice extent through the rest of the melt season.


----
We're slightly below 2011 in total volume, so it should be slightly easier than last year to reach the record. About like one or two cloudy days over the Arctic in July or August wise.
 
Last edited:

Forum List

Back
Top