Unprecedented Glacier Loss

SSDD

Gold Member
Nov 6, 2012
16,672
1,966
280
I was treated to an outrageous bit of warmer wacko propaganda this morning when I visited this board...The posts that led to this thread are on the thread titled "why is it"....

As usual, I was asking for, and not getting any actual observed evidence that man is causing the global climate to change...finally the poster put this bit of pseudo famous warmer propaganda up as evidence that we are causing the climate to change...

38_4_c365-6-l.jpg


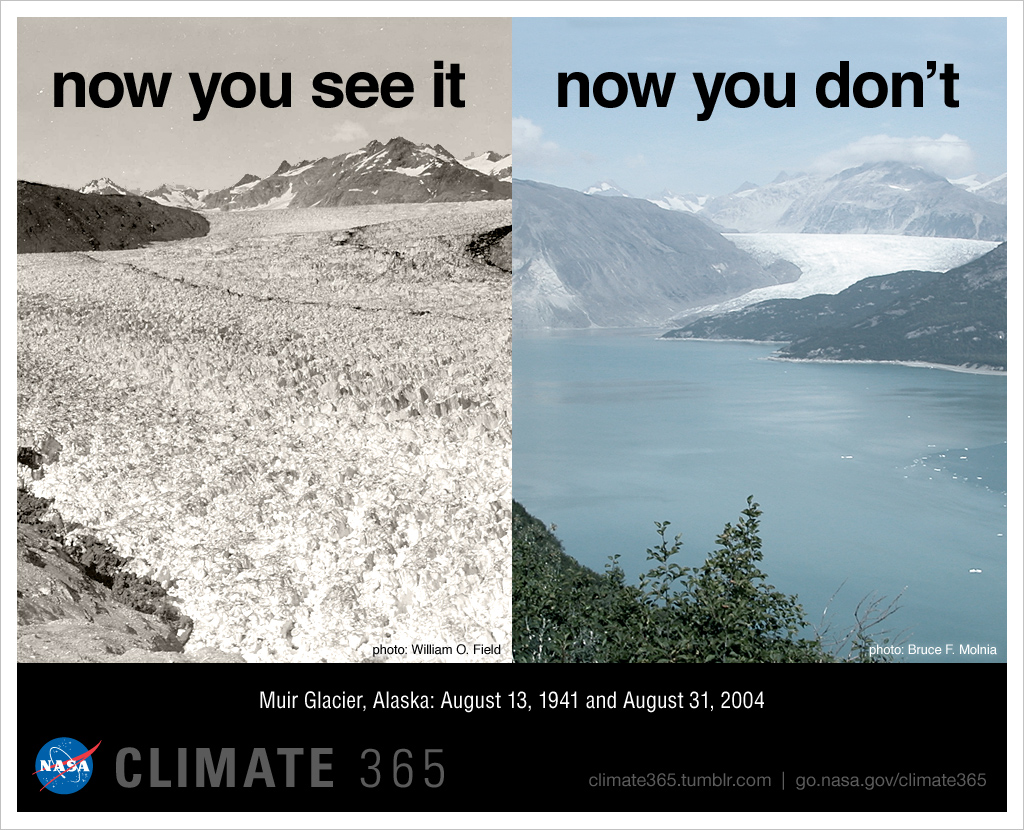
When it was pointed out that glaciers have been melting back for thousands of years, his reply was that in the past, such loss took thousands of years...not mere decades. One of our well known warmist kooks jumped in claiming that it has been millions of years since this sort of melting has taken place...he said, and I quote "The things he is showing you in those photos have NOT happened within human history and they have probably not happened at that rate for the last 65 million years"

Now the picture above certainly paints a grim picture if this is the only information you have...and if you are a blithering idiot...easily fooled, and lacking any critical thinking skills at all, I suppose this photo could convince you that things are really looking bad...

The photo above is typical of warmer propaganda....it is tailored to fool those they lovingly identify as useful idiots...you know...those who believe even though there isn't the first bit of actual evidence supporting the AGW hypothesis...those who post the sort of bullshit the photo above represents...

Well, let me get to the punchline of this story....What the propaganda photo above fails to show, and for obvious reason is any sort of interim photos...but then, that is the nature of propaganda...isn't it. Here, have one more look at the Muir glacier, taken in 1941 and then a second historical photo taken a mere nine years after the "before picture" in 1950...

Again...Before:
Glac17A_Field_1950LG.jpg


Nine years Later...1950:
Muir+Glacier+and+Inlet+(1950)+-+Photos+of+Alaska+Then+And+Now.+This+is+A+Get+Ready+to+Be+Shocked+When+You+See+What+it+Looks+Like+Now..jpg


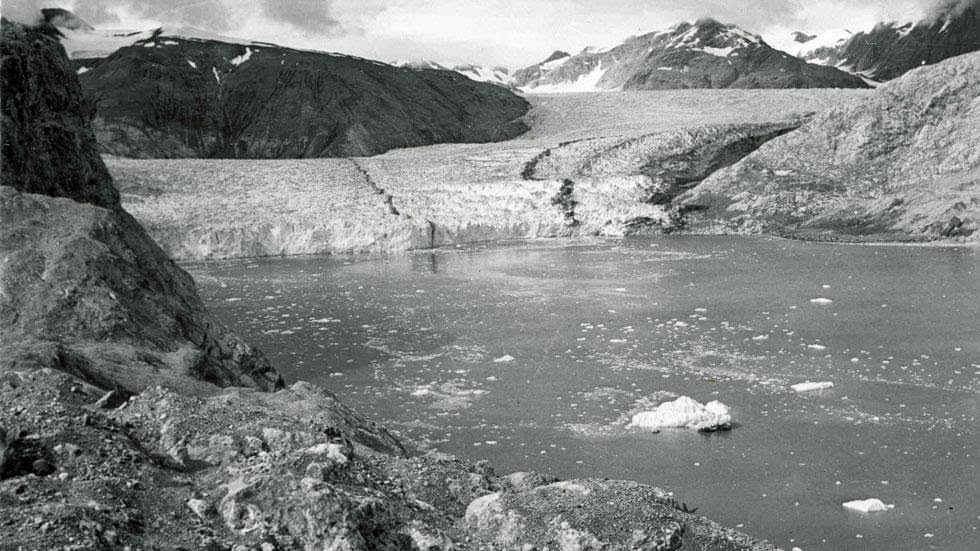
Most of the glacier melting happened a mere 9 years after the first photo was taken...not thousands of years as the poster claimed was the case...and the last time we saw glaciers retreating at this speed certainly wasn't 65 million years ago as our well known warmer wacko claimed...

As an afterthought, it should be noted that in the earliest photo, the bottom right of the photo shows the end of the glacier...note that in the modern photo, there is a much longer view of the area giving the impression much more ice loss....note that the modern photo shows two points of land on the far shore...

And this is just one instance of the never ending stream of propaganda put out by climate science and their willing accomplices in the media to be gobbled up and regurgitated by an ever growing army of brain dead useful idiots....
 
Last edited:
I couldn't agree more. I went through all this a few years ago but it is still true.

you have to actually think about things rather than just take things at face value because it has been shown over and over again that evidence is presented in such a way as to imply conclusions that are poorly supported.
 
glacierbaymap1.gif


glaciers have been retreating since the end of the Little Ice Age. they will continue to retreat until the globe starts to cool again.
 
USGS CMG InfoBank Geology School: glacial retreat

fs20093046_fig05.png


Figure 5. Cumulative net balance of South Cascade, Wolverine, and Gulkana Glaciers (Josberger and others, 2007). Densities of snow and ice differ considerably and before glacier-average thickness changes in each material can be summed to the net balance, the changes must be converted to a common basis. By custom, the common basis is "meters water equivalent" (MWEQ), which is the thickness of water that would result from melting a given thickness of snow or ice.

USGS Fact Sheet 2009–3046: Fifty-Year Record of Glacier Change Reveals Shifting Climate in the Pacific Northwest and Alaska, USA

glacie3.jpg
glacie6.gif


Global glacier retreat

Well now, it sure is easy to show the bullshit being spewed in the previous posts is just that. Many more sites from the geological services of other nations and universities to show how the recession of the glaciers has increased in the last 100 years, especially the last 50.
 
Well now, it sure is easy to show the bullshit being spewed in the previous posts is just that. Many more sites from the geological services of other nations and universities to show how the recession of the glaciers has increased in the last 100 years, especially the last 50.

Three words rocks....so f'ing what? Doesn't one expect glaciers to melt coming out of an ice age?...Clearly, melting glaciers is nothing new...nor is the rate at which they are receding...once more...so f'ing what?
 
So, you are too fucking dumb of an asshole to know that many agricultural areas around the world depend on summer glacial melt for irrigation water. And, warm enough to melt the glaciers, warm enough to melt the permafrost. Which, of course, means absolutely nothing to you.
 
So, you are too fucking dumb of an asshole to know that many agricultural areas around the world depend on summer glacial melt for irrigation water. And, warm enough to melt the glaciers, warm enough to melt the permafrost. Which, of course, means absolutely nothing to you.

And since this is all part and parcel of natural variation, what do you suppose that we humans can do about it?

You may as well complain that it rains...or that we don't have 20 hours of daytime and only 4 of night time...or that the moon has phases....or that the ocean has tides...we are at the whim of nature.. and the primary law of nature is adapt or die.
 
So the rate of melting kind of indicates the rate of heating of the atmosphere. And, contrary of what you are saying, actually the last two thousand years mark the beginning of a trend descending back into another ice age.


Expansion of the last 1000 years


Temperature variations during the preceding 12000 years.
This image is a comparison of 11 different published reconstructions changes during the last 2000 years.
File:2000 Year Temperature Comparison.png - Wikipedia

The rapidity of the present glacial melt has only been matched during the time that we were coming out of the Younger Dryas.
 
Looks like we're witnessing another climate change. Something that's been happening for years.
 
Well yes, it has been happening, at an increasing pace, since the start of the industrial revolution.

You don't have the first piece of real evidence to support that claim...none of the temperature "reconstructions" has anything like the resolution required for you to make such a claim with any certainty at all...in short....BULLSHIT.....
 
You think resolution is a problem back to the start of the Industrial Revolution? Hahahhahaaaaa.

Numbnuts, the thermometer was invented in 1617.
 
You think resolution is a problem back to the start of the Industrial Revolution? Hahahhahaaaaa.

Numbnuts, the thermometer was invented in 1617.

So from that, you think you can make the assumption that the temperature increase between then and now is unprecedented in the past 65million years..or even in the past 10,000? Describe the mental gymnastics you must perform to reach that conclusion...surely they would warrant a gold medal in the skid mark olympics.

Tell me crick...did that bit of idiocy sound good in your head before you typed it out?...just interested.
 
Last edited:
averaging proxy temperatures always reduces the variation. a simple mathematical fact. consider averaging two sine waves. only if they are in perfect phase and of the same amplitude will the variation be retained.

proxies are not perfectly in phase, nor do they show the same amplitudes, as can be easily seen.

nature-proxies-17-to-32.jpg


the min and max are different in every case, the shape is different in every case, the amplitude is different in every case. taking the average will disagree with every proxy, both in timing of events and the magnitude of variation. Shakun's graph claims certainty of +/- a few tenths of a degree. obviously exaggerated certainty, precision and accuracy, as well the timing of events is also in question.
 
You didn't read Shakun's methodology, did you. You should have.

METHODS SUMMARY The data set compiled in this study contains most published high-resolution (median resolution, 200 yr), well-dated (n 5 636 radiocarbon dates) temperature records from the last deglaciation (see Supplementary Information for the full database). Sixty-seven records are from the ocean and are interpreted to reflect sea surface temperatures, and the remaining 13 record air or lake temperatures on land. All records span 18–11 kyr ago and ,85% of them span 22–6.5 kyr ago. We recalibrated all radiocarbon dates with the IntCal04 calibration (Supplementary Information) and converted proxy units to temperature using the reservoir corrections and proxy calibrations suggested in the original publications. An exception to this was the alkenone records, which were recalibrated with a global core-top calibration41. The data were projected onto a 5u 3 5u grid, linearly interpolated to 100-yr resolution and combined as area-weighted averages. We used Monte Carlo simulations to quantify pooled uncertainties in the age models and proxy temperatures, although we do not account for analytical uncertainties or uncertainties related to lack of global coverage and spatial bias in the data set. In particular, the records are strongly biased towards ocean margins where high sedimentation rates facilitate the development of high-resolution records. Given these issues, we focus on the temporal evolution of temperature through the deglaciation rather than on its amplitude of change. The global temperature stack is not particularly sensitive to interpolation resolution, areal weighting, the number of proxy records, radiocarbon calibration, infilling of missing data or proxy type. Details on the experimental design of the transient model simulations can be found in ref. 25. The temperature stacks and proxy data set are available in Supplementary Information.
 
Translation....we tortured the data as much as necessary to make it say what we required.
 
You didn't read Shakun's methodology, did you. You should have.


...Given these issues, we focus on the temporal evolution of temperature through the deglaciation rather than on its amplitude of change...

I think I already gave you an example of how the Younger Dryas as per Shakun didnt seem to match up with timeline of the actual proxy data.
 

Forum List

Back
Top