Unemployment numbers are lies.

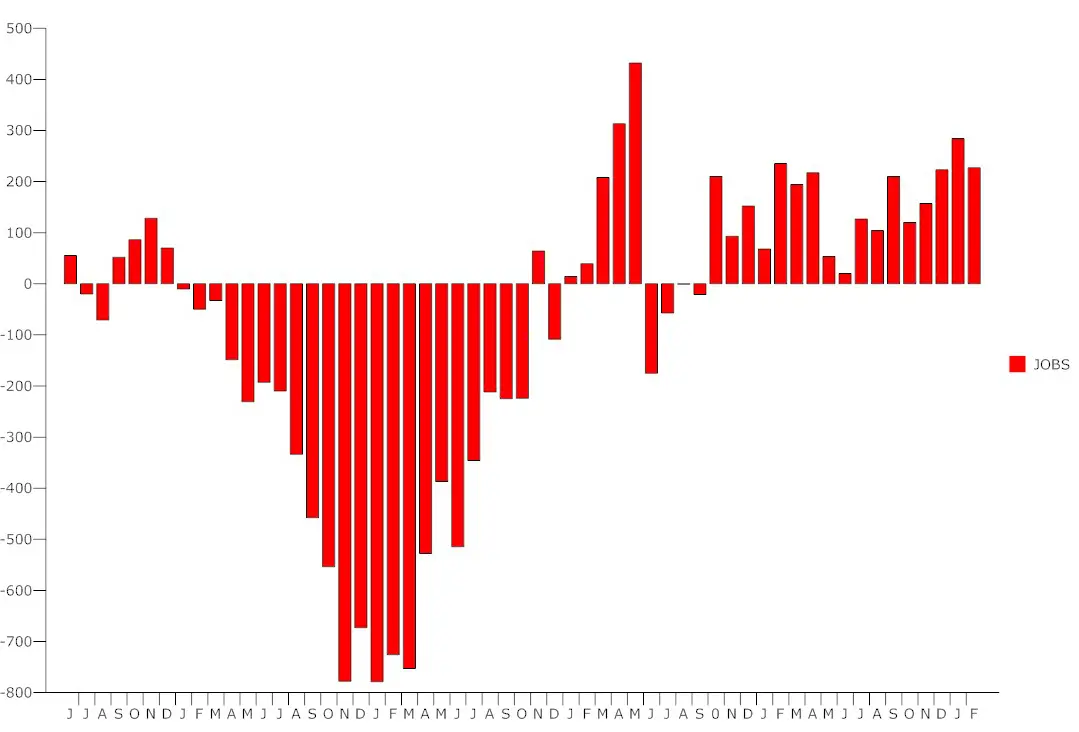
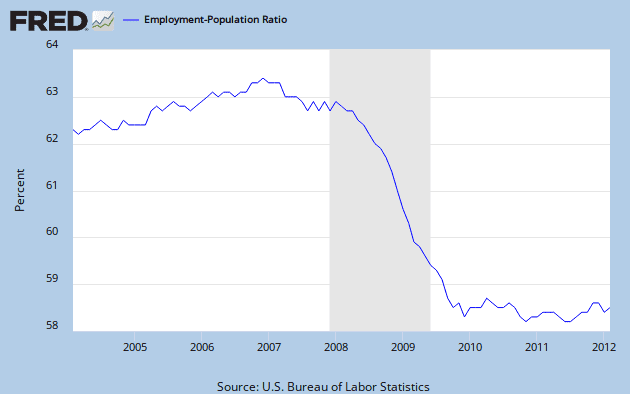
Because ADP, TrimTabs & the BLS all say we are adding jobs I am inclined to think we are headed in the right direction regardless of the flakey unemployment numbers. The unadjusted Employment-population ratio is improving ever so slowly. This improvement just needs to speed up.

Does that include the couple of million jobs that no longer exist?

I would hope those fake stimulus jobs are not added in.

The unadjusted Employment-population ratio includes the people who were dumped off of the UE rolls & should be the most accurate measure. The ~6 months improvement is shown on the EMRATIO chart below. It is just so minuscule & minute compared to what this country needs. After debt spending all of our treasury they have to get to this point I can't believe they are busy crowing & patting themselves on the back about it.

fredgraph.png
 
Last edited:

So? Is Gallup using a methodology that is more comprehensive and more verifiably accurate than the Bureau of Labor Statistics?

They are accurate. They are just not seasonally adjusting their numbers like the BLS is. Guess what? The BLS not seasonally adjusted UE number is 9.3% which is actually higher than Gallup's 9.1%. So the BLS seasonal adjusted headline grabbing 8.3% UE number may still very well rise even if the actual employment situation is improving.

You don't understand the point of seasonal adjustment? Seriously?
 

So? Is Gallup using a methodology that is more comprehensive and more verifiably accurate than the Bureau of Labor Statistics?

They are accurate. They are just not seasonally adjusting their numbers like the BLS is. Guess what? The BLS not seasonally adjusted UE number is 9.3% which is actually higher than Gallup's 9.1%. So the BLS seasonal adjusted headline grabbing 8.3% UE number may still very well rise even if the actual employment situation is improving.

In November of 2011, the seasonally adjusted (headlined) UE rate was 8.7%

The non-seasonal, 'accurate' rate, as you call it, was 8.2%

Were you complaining then that the lower number wasn't headlined??????
 
Top story on DRUDGE this AM....................

Spin it any way you want. Bottom line..........the country is still 6 million jobs short = epic fAiL. In fact.........its such a joke, its absurd. Only the k00ks are saying these are the roaring 2010's!!

U.S. Still Down 6 Million Jobs - Real-Time Advice - SmartMoney


Precisely who is saying these are the roaring 2010's? Perhaps you could provide a link. That would be helpful.

And, once again, no one is disputing that the economy remains lousy or that unemployment is clearly and unacceptably high. The question is why, and what should be done about it.

.
 
The way they figure unemployment since Obama took office gives a false impression of the actual economy.

Underemployment is a major problem these days. How many part-time jobs are considered 40 hr a week jobs?

And simply counting jobs isn't accurate because some folks have to work 2 and 3 jobs just to make ends meet.

I think a better way to figure out the economy is to figure out total earnings, add the cost of living and inflation into that and that will give you a better idea.

Since Obama has more people eligible for food stamps it seems more and more people are poor under this president.
 
Last edited:
So? Is Gallup using a methodology that is more comprehensive and more verifiably accurate than the Bureau of Labor Statistics?

They are accurate. They are just not seasonally adjusting their numbers like the BLS is. Guess what? The BLS not seasonally adjusted UE number is 9.3% which is actually higher than Gallup's 9.1%. So the BLS seasonal adjusted headline grabbing 8.3% UE number may still very well rise even if the actual employment situation is improving.

You don't understand the point of seasonal adjustment? Seriously?

I see no point in any UE number. The unadjusted Employment to Population Ratio (EMRATIO) is the only number that matters. People know if they & their friends & family are unemployed. Government cronies spinning a fake headline UE number changes nothing for real people. As you can see from the the EMRATIO chart below - Real People Are Hurting.

fredgraph.png
 
Last edited:
First, there's no upper age limit for the adult civilian non-institutional population.

Second, since any benchmark LF participation rate is purely arbitrary, and since the rate can change for non labor market reasons, it's not objective.

Third, the adjustment doesn't work both ways: if we use the LF rate from the 50s, that would show our cerrent UE rate as negative.

Third, Gallup has a margin of error of +/- 0.7% (mening there range is from 8.6% to 9.8%) while the BLS error is +/- 0.2%

Fourth, the methodology hasn't had any major changes since 1967, the only change under Obama was allowing responses of more than 2 years for duration of unemployment and that had no effect on the rate (before, anyone unemployed over 2 years were classified as 2 years)
 
They are accurate. They are just not seasonally adjusting their numbers like the BLS is. Guess what? The BLS not seasonally adjusted UE number is 9.3% which is actually higher than Gallup's 9.1%. So the BLS seasonal adjusted headline grabbing 8.3% UE number may still very well rise even if the actual employment situation is improving.

You don't understand the point of seasonal adjustment? Seriously?

I see no point in any UE number. The unadjusted Employment to Population Ratio (EMRATIO) is the only number that matters. People know if they & their friends & family are unemployed. Government cronies spinning a fake headline UE number changes nothing for real people. As you can see from the the EMRATIO chart below - Real People Are Hurting.


Just So Folks Don't Get Wrapped Up In A Bunch Of Republican Wishing. Don't forget who wrecked the economy or especially how bad it was wrecked. Never before in the history of a captitalist society has the government had to turn over nearly a trillion dollars to banks. Only a foolish person could view these records and think Obama did anything to continue the down spiral of the great recession.

us-unemployment-feb-2012.jpg


political-pictures-barack-obama-mitt-romney-work-fights.jpg

jobs gained or lost by month during the Bush-Obama administrations
 
Last edited:
Just So Folks Don't Get Wrapped Up In A Bunch Of Republican Wishing. Don't forget who wrecked the economy or especially how bad it was wrecked. Never before in the history of a captitalist society has the government had to turn over nearly a trillion dollars to banks:

I know - Democrats took power in 2007 causing millions to lose their jobs, the economy went to shit & the deficit soared.
 
I believe we should go to a format of measuring unemployment using the average labor participation rate of 66%. If you look through history the labor force has almost always been just above or just below 66%, until recently. This is why it should be the standard and not the moving target. I mean how much sense does 8.3% being different than 8.3% last month, a year ago, or a year from now all being different. 8.3% should mean 8.3% period. It makes no sense what so ever the way it is now. Currently everyone is boasting an 8.3% unemployment rate. However, that is at the current labor participation rate of 63.9%. If the rate were the average 66%, the unemployment rate would actually be 11.2%. Heck if the labor force was the same as when Obama took office the unemployment rate would be 10.5%. The fact is they use the ability to move the labor force around to make things seem better than they really are. But in the end we are just being lied to.


January 2009
Population 234,739
Labor Force 153,716 Rate: 65.5
Employed: 142,099 Rate: 60.5
Unemployed: 11,616 Rate: 7.6


February 2012
Population 242,435
Labor Force 154,871 Rate: 63.9
Employed: 142,065 Rate: 58.6
Unemployed: 12,806 Rate: 8.3


If labor force was same as 01/09 65.5

Population 242,435
Labor Force 158,794 Rate: 65.5
Employed: 142,065 Rate: 58.6
Unemployed: 16,729 Rate: 10.5

If the labor force was it’s average rate of 66 the unemployment would be

Population 242,435
Labor Force 160,007 Rate: 66
Employed: 142,065 Rate: 58.6
Unemployed: 17,942 Rate: 11.2

The formula used to equate our unemployment rate is flawed at best...

The formula doesn't account for those who have exhausted their unemployment insurance, it doesn't count those who don't qualify for unemployment insurance...

The equation is total labor force divided by "active job seekers" (those currently receiving unemployment benefits).

So you can bet the more people being booted off unemployment means the more our unemployment rate will drop.

The real unemployment numbers have done nothing but climb, while the "official number" has fallen.

The misery index is a far better formula to calculate the impact of an economy on the individual, however it's more complicated.
 
Last edited:
First, there's no upper age limit for the adult civilian non-institutional population.

Second, since any benchmark LF participation rate is purely arbitrary, and since the rate can change for non labor market reasons, it's not objective.

Third, the adjustment doesn't work both ways: if we use the LF rate from the 50s, that would show our cerrent UE rate as negative.

Third, Gallup has a margin of error of +/- 0.7% (mening there range is from 8.6% to 9.8%) while the BLS error is +/- 0.2%

Fourth, the methodology hasn't had any major changes since 1967, the only change under Obama was allowing responses of more than 2 years for duration of unemployment and that had no effect on the rate (before, anyone unemployed over 2 years were classified as 2 years)
The current Gallup poll that has CON$erviNutzis so euphoric has a sampling error of + or - 1%, not .7%, so Gallup's accuracy is getting worse and therefore CON$ love it more.

U.S. Unemployment Up in February

Survey Methods Gallup classifies American workers as underemployed if they are either unemployed or working part time but wanting full-time work. The findings reflect more than 25,000 phone interviews with U.S. adults, aged 18 and older in the workforce, collected during a given month. Gallup's results are not seasonally adjusted and are ahead of government reports by approximately two weeks.
Results are based on telephone interviews conducted as part of Gallup Daily tracking from Feb. 1-29, 2012, with a random sample of 27,275 adults, aged 18 and older, living in all 50 U.S. states and the District of Columbia, selected using random-digit-dial sampling.
For results based on the total sample of U.S. workers in the workforce, one can say with 95% confidence that the maximum margin of sampling error is ±1 percentage point.
Interviews are conducted with respondents on landline telephones and cellular phones, with interviews conducted in Spanish for respondents who are primarily Spanish-speaking. Each sample includes a minimum quota of 400 cell phone respondents and 600 landline respondents per 1,000 national adults, with additional minimum quotas among landline respondents by region. Landline telephone numbers are chosen at random among listed telephone numbers. Cell phone numbers are selected using random-digit-dial methods. Landline respondents are chosen at random within each household on the basis of which member had the most recent birthday.
Samples are weighted by gender, age, race, Hispanic ethnicity, education, region, adults in the household, and phone status (cell phone only/landline only/both, cell phone mostly, and having an unlisted landline number). Demographic weighting targets are based on the March 2011 Current Population Survey figures for the aged 18 and older non-institutionalized population living in U.S. telephone households. All reported margins of sampling error include the computed design effects for weighting and sample design.
In addition to sampling error, question wording and practical difficulties in conducting surveys can introduce error or bias into the findings of public opinion polls.
 
Just So Folks Don't Get Wrapped Up In A Bunch Of Republican Wishing. Don't forget who wrecked the economy or especially how bad it was wrecked. Never before in the history of a captitalist society has the government had to turn over nearly a trillion dollars to banks:

I know - Democrats took power in 2007 causing millions to lose their jobs, the economy went to shit & the deficit soared.
So tell us what bill did the Dems pass in 2007 over a GOP filibuster and Bush's veto that caused millions to lose their jobs and turned the glorious Bush economy instantly to the shit it was all along?????
 
I believe we should go to a format of measuring unemployment using the average labor participation rate of 66%. If you look through history the labor force has almost always been just above or just below 66%, until recently. This is why it should be the standard and not the moving target. I mean how much sense does 8.3% being different than 8.3% last month, a year ago, or a year from now all being different. 8.3% should mean 8.3% period. It makes no sense what so ever the way it is now. Currently everyone is boasting an 8.3% unemployment rate. However, that is at the current labor participation rate of 63.9%. If the rate were the average 66%, the unemployment rate would actually be 11.2%. Heck if the labor force was the same as when Obama took office the unemployment rate would be 10.5%. The fact is they use the ability to move the labor force around to make things seem better than they really are. But in the end we are just being lied to.


January 2009
Population 234,739
Labor Force 153,716 Rate: 65.5
Employed: 142,099 Rate: 60.5
Unemployed: 11,616 Rate: 7.6


February 2012
Population 242,435
Labor Force 154,871 Rate: 63.9
Employed: 142,065 Rate: 58.6
Unemployed: 12,806 Rate: 8.3


If labor force was same as 01/09 65.5

Population 242,435
Labor Force 158,794 Rate: 65.5
Employed: 142,065 Rate: 58.6
Unemployed: 16,729 Rate: 10.5

If the labor force was it’s average rate of 66 the unemployment would be

Population 242,435
Labor Force 160,007 Rate: 66
Employed: 142,065 Rate: 58.6
Unemployed: 17,942 Rate: 11.2

The formula used to equate our unemployment rate is flawed at best...

The formula doesn't account for those who have exhausted their unemployment insurance, it doesn't count those who don't qualify for unemployment insurance...

The equation is total labor force divided by "active job seekers" (those currently receiving unemployment benefits).

So you can bet the more people being booted off unemployment means the more our unemployment rate will drop.

The real unemployment numbers have done nothing but climb, while the "official number" has fallen.

The misery index is a far better formula to calculate the impact of an economy on the individual, however it's more complicated.
Lie on top of lie! :eusa_liar::eusa_liar:
CON$erviNutzis can't breath without lying.

Unemployment Rate Definition, Example & Formula | InvestingAnswers

Economics: Unemployment Rate

You're a fucking idiot...

You see how easy that was???

It would take an individual 10 fucking minuets to thoroughly understand unemployment, how it works and the formula itself is calculated.

Funny how you're too lazy to do that and call bullshit first despite your astute ignorance on the simplest of simple...
 
Last edited:
First, there's no upper age limit for the adult civilian non-institutional population.

Second, since any benchmark LF participation rate is purely arbitrary, and since the rate can change for non labor market reasons, it's not objective.

Third, the adjustment doesn't work both ways: if we use the LF rate from the 50s, that would show our cerrent UE rate as negative.

Third, Gallup has a margin of error of +/- 0.7% (mening there range is from 8.6% to 9.8%) while the BLS error is +/- 0.2%

Fourth, the methodology hasn't had any major changes since 1967, the only change under Obama was allowing responses of more than 2 years for duration of unemployment and that had no effect on the rate (before, anyone unemployed over 2 years were classified as 2 years)
The current Gallup poll that has CON$erviNutzis so euphoric has a sampling error of + or - 1%, not .7%, so Gallup's accuracy is getting worse and therefore CON$ love it more.

U.S. Unemployment Up in February

Survey Methods Gallup classifies American workers as underemployed if they are either unemployed or working part time but wanting full-time work. The findings reflect more than 25,000 phone interviews with U.S. adults, aged 18 and older in the workforce, collected during a given month. Gallup's results are not seasonally adjusted and are ahead of government reports by approximately two weeks.
Results are based on telephone interviews conducted as part of Gallup Daily tracking from Feb. 1-29, 2012, with a random sample of 27,275 adults, aged 18 and older, living in all 50 U.S. states and the District of Columbia, selected using random-digit-dial sampling.
For results based on the total sample of U.S. workers in the workforce, one can say with 95% confidence that the maximum margin of sampling error is ±1 percentage point.
Interviews are conducted with respondents on landline telephones and cellular phones, with interviews conducted in Spanish for respondents who are primarily Spanish-speaking. Each sample includes a minimum quota of 400 cell phone respondents and 600 landline respondents per 1,000 national adults, with additional minimum quotas among landline respondents by region. Landline telephone numbers are chosen at random among listed telephone numbers. Cell phone numbers are selected using random-digit-dial methods. Landline respondents are chosen at random within each household on the basis of which member had the most recent birthday.
Samples are weighted by gender, age, race, Hispanic ethnicity, education, region, adults in the household, and phone status (cell phone only/landline only/both, cell phone mostly, and having an unlisted landline number). Demographic weighting targets are based on the March 2011 Current Population Survey figures for the aged 18 and older non-institutionalized population living in U.S. telephone households. All reported margins of sampling error include the computed design effects for weighting and sample design.
In addition to sampling error, question wording and practical difficulties in conducting surveys can introduce error or bias into the findings of public opinion polls.
At 95% confidence it's +/- 0.1%, I was using 90% confidence. At 95% confidence BLS error is 0.23%

Note, too BLS uses 16 and older with a sample of 60,000 HOUSEHOLDS.
And they don't use random digit dialing, it's much more complicated.
 
I believe we should go to a format of measuring unemployment using the average labor participation rate of 66%. If you look through history the labor force has almost always been just above or just below 66%, until recently. This is why it should be the standard and not the moving target. I mean how much sense does 8.3% being different than 8.3% last month, a year ago, or a year from now all being different. 8.3% should mean 8.3% period. It makes no sense what so ever the way it is now. Currently everyone is boasting an 8.3% unemployment rate. However, that is at the current labor participation rate of 63.9%. If the rate were the average 66%, the unemployment rate would actually be 11.2%. Heck if the labor force was the same as when Obama took office the unemployment rate would be 10.5%. The fact is they use the ability to move the labor force around to make things seem better than they really are. But in the end we are just being lied to.


January 2009
Population 234,739
Labor Force 153,716 Rate: 65.5
Employed: 142,099 Rate: 60.5
Unemployed: 11,616 Rate: 7.6


February 2012
Population 242,435
Labor Force 154,871 Rate: 63.9
Employed: 142,065 Rate: 58.6
Unemployed: 12,806 Rate: 8.3


If labor force was same as 01/09 65.5

Population 242,435
Labor Force 158,794 Rate: 65.5
Employed: 142,065 Rate: 58.6
Unemployed: 16,729 Rate: 10.5

If the labor force was it’s average rate of 66 the unemployment would be

Population 242,435
Labor Force 160,007 Rate: 66
Employed: 142,065 Rate: 58.6
Unemployed: 17,942 Rate: 11.2

I hate to shoot holes into your theory, but hey, it is what it is.

In 2007, the unemployment rate was 4.6%, and the labor workforce rate was 66.4%.
In 2012, the unemployment rate is 8.3%, and the labor workforce rate is 63.7%.

Using these numbers, please explain how the unemployment rate is now actually 11.2%. Here, I will help you with this. So as not to make a mistake, the difference in the workforce rate must be divided by the workforce rate of 2007. So 66.4-63.7=2.7/66.4= 4
So now we add the 4% to the unemployment rate during 2007, which was 4.6%. 4.6+4.0=8.6. So according to your methodology, the actual unemployment rate is currently 8.6%. Okay, there is a small difference, but it certainly doesn't come to 11.2%. Unfortunately, this proves that your theory is not consistent. While it may work comparing one year to another, its accuracy does not remain intact for all examples. In order to prove something to be true, it must work all the time, or at least most of the time.
 
Last edited:
The formula used to equate our unemployment rate is flawed at best...

The formula doesn't account for those who have exhausted their unemployment insurance, it doesn't count those who don't qualify for unemployment insurance...

The equation is total labor force divided by "active job seekers" (those currently receiving unemployment benefits).

So you can bet the more people being booted off unemployment means the more our unemployment rate will drop.

The real unemployment numbers have done nothing but climb, while the "official number" has fallen.

The misery index is a far better formula to calculate the impact of an economy on the individual, however it's more complicated.
Lie on top of lie! :eusa_liar::eusa_liar:
CON$erviNutzis can't breath without lying.

Unemployment Rate Definition, Example & Formula | InvestingAnswers

Economics: Unemployment Rate

You're a fucking idiot...

You see how easy that was???

It would take an individual 10 fucking minuets to thoroughly understand unemployment, how it works and the formula itself is calculated.

Funny how you're too lazy to do that and call bullshit first despite your astute ignorance on the simplest of simple...
Neither link says only people collecting benefits are counted. That's your lie.
From Employment Situation Technical Note
The unemployment data derived from the household survey in no way depend upon the eligibility for or receipt of unemployment insurance benefits.
 

Forum List

Back
Top