Tracking the el nino

BTW, why can't super hero climate guy make it rain in California? Just saying

Too busy with the Texas takeover. Didn't you know? Huh.
So I guess California doesn't rate up there so many years?

Of course not. Too many resources tied up trying to put down those Texas two-steppers, don'tcha know.
meaning California isn't worth it then!!

Why would Obama flood California with his secret weather machine? Unlike Texas, California likes him. You didn't know? Huh.
So he gave all of California water to texas. seems like the opposite. See Texas was in a drought as well. DOH!!!!!
 
globalsst_nowcast_anim30d.gif


IN this world view you can see that the Indian Ocean is harboring most of the heat. The cross over into the Indian ocean through the Archipelago renders the heated water dead. Without oscillations to push it back across the pacific there is no significant El Nino..

So you are now a supporter of "guvment" models. This is an interesting turn of events. Did Al Gore work his voodoo on your too?

Your own models show the cooling of the ocean waters, which is the point I was driving home, and it still went over your head..

You must be color blind, because what I see is deep red in the equatorial region all across the planet!
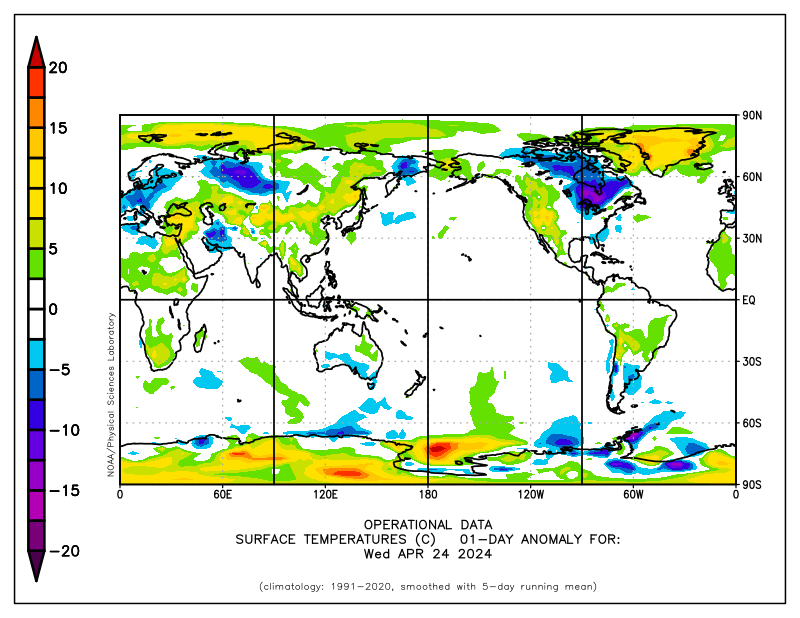
hahahahahahahahahahaahhaahah, you do know that is a temperature map and not an anomaly map right?

HE missed that point... The anomalies are near zero right now..

You are missing the flow pattern. Whereas before, we were seeing subdued temperatures across the equatorial pacific, and flow from west to east, we now see temperatures shifted in the deep red, and flowing from east to west, just as EVERY PREVIOUS EL NINO HAS DONE.

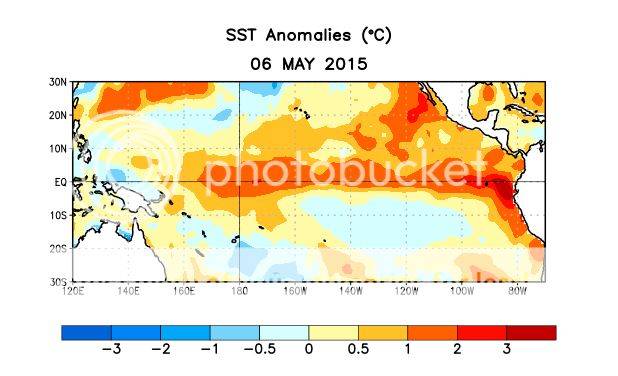
But hey, if you want the anomaly map, here it is:

el%20nino_zps7nadbkht.jpg

Figure 1. Average sea surface temperature (SST) anomalies (°C) for the week centered on 6 May 2015. Anomalies are computed with respect to the 1981-2010 base period weekly means.

http://www.cpc.ncep.noaa.gov/products/analysis_monitoring/enso_advisory/ensodisc.pdf

By early May 2015, weak to moderate El Niño conditions were reflected by above-average sea surface temperatures (SST) across the equatorial Pacific (Fig. 1), and by the corroborating tropical atmospheric response. The latest weekly Niño indices were +1.2°C in the Niño-4 region, +1.0°C in the Niño-3.4 region, and +1.2°C and +2.3°C in the Niño-3 and Niño-1+2 regions, respectively (Fig. 2). Subsurface temperature anomalies remained substantially above average (Fig. 3), partly in response to a downwelling oceanic Kelvin wave, which resulted in strong positive subsurface anomalies across the central and eastern Pacific (Fig. 4). This anomalous warmth has subsequently persisted in association with El Niño-related ocean-atmosphere coupling. This coupling includes enhanced convection over the central equatorial Pacific (Fig. 5), along with persistent low-level westerly wind anomalies over the western and central equatorial Pacific and persistent upper-level easterly wind anomalies over the central Pacific. Also, the equatorial Southern Oscillation Index (EQSOI) remained negative during the month. Collectively, these features reflect weak to moderate strength El Niño conditions.


Nearly all models predict El Niño (3-month values of the Niño-3.4 index 0.5°C or greater) to continue throughout 2015, and many are also predicting SST anomalies to increase during the next several months (Fig. 6). These forecasts are supported by the continuation of positive subsurface temperature anomalies, enhanced convection near the Date Line, and the persistence of low-level westerly wind anomalies. Given these factors, it is likely that SST anomalies will continue to increase in the coming months. However, model forecast skill tends to be lower during the Northern Hemisphere spring, which somewhat limits confidence in these forecasts. Therefore, there remains considerable uncertainty about how strong this event may become. In summary, there is an approximately 90% chance that El Niño will continue through Northern Hemisphere summer 2015, and a greater than 80% chance it will last through 2015 (click CPC/IRI consensus forecast for the chance of each outcome for each 3-month period).

This discussion is a consolidated effort of the National Oceanic and Atmospheric Administration (NOAA), NOAA’s National Weather Service, and their funded institutions. Oceanic and atmospheric conditions are updated weekly on the Climate Prediction Center web site (El Niño/La Niña Current Conditions and Expert Discussions). Forecasts are also updated monthly in the Forecast Forum of CPC's Climate Diagnostics Bulletin. Additional perspectives and analysis are also available in an ENSO blog. The next ENSO Diagnostics Discussion is scheduled for 11 June 2015. To receive an e-mail notification when the monthly ENSO Diagnostic Discussions are released, please send an e-mail message to: [email protected].

Right. El Nino. Next.
 
So you are now a supporter of "guvment" models. This is an interesting turn of events. Did Al Gore work his voodoo on your too?

Your own models show the cooling of the ocean waters, which is the point I was driving home, and it still went over your head..

You must be color blind, because what I see is deep red in the equatorial region all across the planet!
hahahahahahahahahahaahhaahah, you do know that is a temperature map and not an anomaly map right?

HE missed that point... The anomalies are near zero right now..
I know. He thought those were anomalies showing big time change. this shit cracks me up. And he'll deny it. watch.
sfctmpmer_01a.fnl.11.gif

Here is May 9ths map..
 
So you are now a supporter of "guvment" models. This is an interesting turn of events. Did Al Gore work his voodoo on your too?

Your own models show the cooling of the ocean waters, which is the point I was driving home, and it still went over your head..

You must be color blind, because what I see is deep red in the equatorial region all across the planet!
hahahahahahahahahahaahhaahah, you do know that is a temperature map and not an anomaly map right?

HE missed that point... The anomalies are near zero right now..

You are missing the flow pattern. Whereas before, we were seeing subdued temperatures across the equatorial pacific, and flow from west to east, we now see temperatures shifted in the deep red, and flowing from east to west, just as EVERY PREVIOUS EL NINO HAS DONE.

But hey, if you want the anomaly map, here it is:

el%20nino_zps7nadbkht.jpg

Figure 1. Average sea surface temperature (SST) anomalies (°C) for the week centered on 6 May 2015. Anomalies are computed with respect to the 1981-2010 base period weekly means.

http://www.cpc.ncep.noaa.gov/products/analysis_monitoring/enso_advisory/ensodisc.pdf

By early May 2015, weak to moderate El Niño conditions were reflected by above-average sea surface temperatures (SST) across the equatorial Pacific (Fig. 1), and by the corroborating tropical atmospheric response. The latest weekly Niño indices were +1.2°C in the Niño-4 region, +1.0°C in the Niño-3.4 region, and +1.2°C and +2.3°C in the Niño-3 and Niño-1+2 regions, respectively (Fig. 2). Subsurface temperature anomalies remained substantially above average (Fig. 3), partly in response to a downwelling oceanic Kelvin wave, which resulted in strong positive subsurface anomalies across the central and eastern Pacific (Fig. 4). This anomalous warmth has subsequently persisted in association with El Niño-related ocean-atmosphere coupling. This coupling includes enhanced convection over the central equatorial Pacific (Fig. 5), along with persistent low-level westerly wind anomalies over the western and central equatorial Pacific and persistent upper-level easterly wind anomalies over the central Pacific. Also, the equatorial Southern Oscillation Index (EQSOI) remained negative during the month. Collectively, these features reflect weak to moderate strength El Niño conditions.


Nearly all models predict El Niño (3-month values of the Niño-3.4 index 0.5°C or greater) to continue throughout 2015, and many are also predicting SST anomalies to increase during the next several months (Fig. 6). These forecasts are supported by the continuation of positive subsurface temperature anomalies, enhanced convection near the Date Line, and the persistence of low-level westerly wind anomalies. Given these factors, it is likely that SST anomalies will continue to increase in the coming months. However, model forecast skill tends to be lower during the Northern Hemisphere spring, which somewhat limits confidence in these forecasts. Therefore, there remains considerable uncertainty about how strong this event may become. In summary, there is an approximately 90% chance that El Niño will continue through Northern Hemisphere summer 2015, and a greater than 80% chance it will last through 2015 (click CPC/IRI consensus forecast for the chance of each outcome for each 3-month period).

This discussion is a consolidated effort of the National Oceanic and Atmospheric Administration (NOAA), NOAA’s National Weather Service, and their funded institutions. Oceanic and atmospheric conditions are updated weekly on the Climate Prediction Center web site (El Niño/La Niña Current Conditions and Expert Discussions). Forecasts are also updated monthly in the Forecast Forum of CPC's Climate Diagnostics Bulletin. Additional perspectives and analysis are also available in an ENSO blog. The next ENSO Diagnostics Discussion is scheduled for 11 June 2015. To receive an e-mail notification when the monthly ENSO Diagnostic Discussions are released, please send an e-mail message to: [email protected].

Right. El Nino. Next.

Why dont you use something unadjusted and more current... like I did?
 
Your own models show the cooling of the ocean waters, which is the point I was driving home, and it still went over your head..

You must be color blind, because what I see is deep red in the equatorial region all across the planet!
hahahahahahahahahahaahhaahah, you do know that is a temperature map and not an anomaly map right?

HE missed that point... The anomalies are near zero right now..
I know. He thought those were anomalies showing big time change. this shit cracks me up. And he'll deny it. watch.
sfctmpmer_01a.fnl.11.gif

Here is May 9ths map..

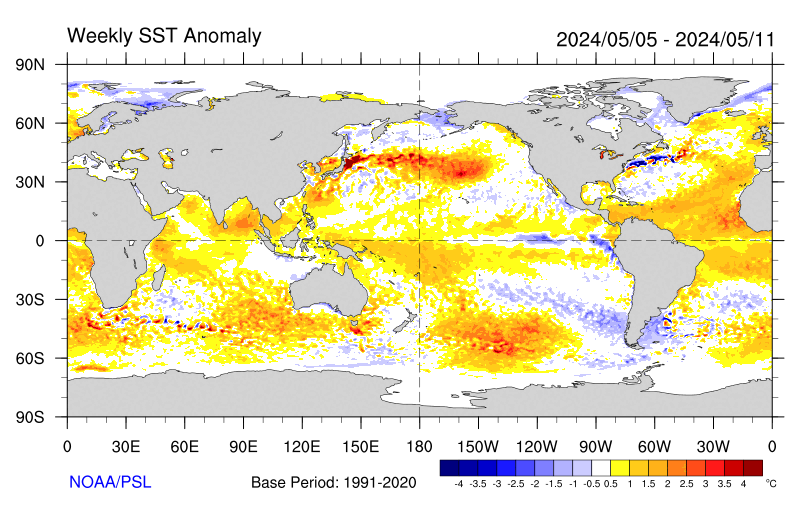
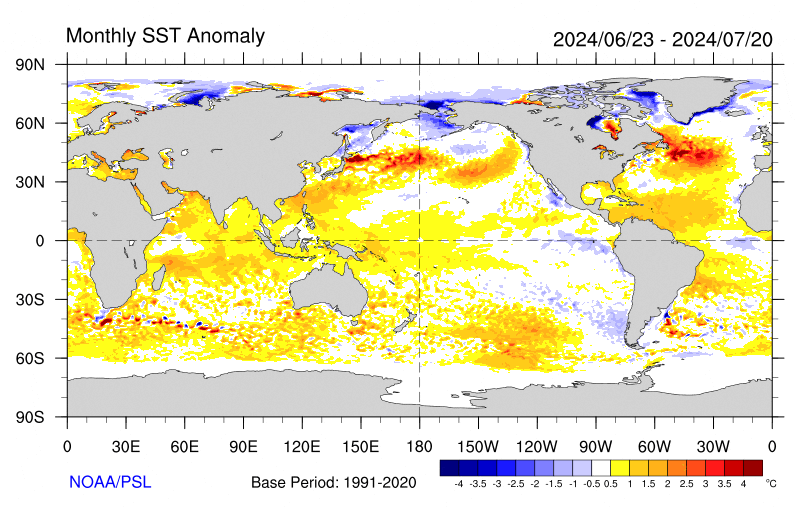
Here are some more recent maps:

sst.anom.gif


sst.anom.month.gif


And the source:

ESRL PSD Current State of the Tropical Pacific
 
5.gif


Better yet is May 20ths Showing the blob and its location above the undersea volcano that has now been erupting for over three weeks. Note the equatorial lack of heating and no warm pool. El Nada continues..

http://www1.ncdc.noaa.gov/pub/data/wksst/5.gif

Idiot. For an undersea volcano to heat that much water, it would have to be the largest eruption in 10,000 years, at the least. You have to be a completely fucking idiot to try to pull that one off. Unfucking believable.
 
Even the super nino of 1997-1998 doesn't boast a 1.3c at 3.4 in early June!!

Saying that we don't have a nino in the face of a possible super nino is funny. lol
Dude, it's but a prediction it's not here and most likely won't be first you need some weather that is caused by it
 
Trying to take the really stupid title from Billy Boob, jc?

http://www.cpc.ncep.noaa.gov/products/analysis_monitoring/lanina/enso_evolution-status-fcsts-web.pdf

ENSO Alert System Status: El Niño Advisory
El Niño conditions are present.*
Positive equatorial sea surface temperature (SST) anomalies continue across
most of the Pacific Ocean.
There is an approximately 90% chance that El Niño conditions will continue
through Northern Hemisphere summer 2015, and a greater than 80% chance
it will last through 2015.*
 
http://www.cpc.ncep.noaa.gov/products/analysis_monitoring/lanina/enso_evolution-status-fcsts-web.pdf

El Niño: characterized by a positive ONI greater than or equal to +0.5ºC.
La Niña: characterized by a negative ONI less than or equal to -0.5ºC.
By historical standards, to be classified as a full-fledged El Niño or La Niña episode,
these thresholds must be exceeded for a period of at least 5 consecutive overlapping
3-month seasons.
CPC considers El Niño or La Niña conditions to occur when the monthly Niño3.4 OISST
departures meet or exceed +/- 0.5ºC along with consistent atmospheric features. These
anomalies must also be forecasted to persist for 3 consecutive months.


The latest weekly SST
departures are:
Niño 4 1.1ºC
Niño 3.4 1.3ºC
Niño 3 1.4ºC
Niño 1+2 2.6ºC
 
Trying to take the really stupid title from Billy Boob, jc?

http://www.cpc.ncep.noaa.gov/products/analysis_monitoring/lanina/enso_evolution-status-fcsts-web.pdf

ENSO Alert System Status: El Niño Advisory
El Niño conditions are present.*
Positive equatorial sea surface temperature (SST) anomalies continue across
most of the Pacific Ocean.
There is an approximately 90% chance that El Niño conditions will continue
through Northern Hemisphere summer 2015, and a greater than 80% chance
it will last through 2015.*
IT's A PREDICTION no more. Prove it isn't. Prove where there is an el nino weather pattern. Please one spot.
 
http://www.cpc.ncep.noaa.gov/products/analysis_monitoring/lanina/enso_evolution-status-fcsts-web.pdf

El Niño: characterized by a positive ONI greater than or equal to +0.5ºC.
La Niña: characterized by a negative ONI less than or equal to -0.5ºC.
By historical standards, to be classified as a full-fledged El Niño or La Niña episode,
these thresholds must be exceeded for a period of at least 5 consecutive overlapping
3-month seasons.
CPC considers El Niño or La Niña conditions to occur when the monthly Niño3.4 OISST
departures meet or exceed +/- 0.5ºC along with consistent atmospheric features. These
anomalies must also be forecasted to persist for 3 consecutive months.


The latest weekly SST
departures are:
Niño 4 1.1ºC
Niño 3.4 1.3ºC
Niño 3 1.4ºC
Niño 1+2 2.6ºC
PREDICTION no more no less. And don't mean jack!
 
Fuck, you are one dumb ass, jc. Every zone is above 1.0. 0.5 represents an El Nino. That is last weeks numbers. The prediction is for the El Nino to continue through to 2016.
 

Forum List

Back
Top