Billy_Bob
Diamond Member
Do not validate his bullshit. The hotspot is NOT a requirement of GHG warming. Stratospheric cooling is.
The hotspot is a requirement for any warming. Solar-caused, GHG-caused, magic-caused, it should be there for any warming from any cause. It's a fingerprint of any warming. Stratospheric cooling is the fingerprint unique to GHG warming.
Thus, SSDD kind of destroys his own natural-causes theories by claiming it's not there.
'Course, it is there, so it's all moot.
See? RSS satellite model data, which every denier spent years swearing was the most perfect data ever created by humans.
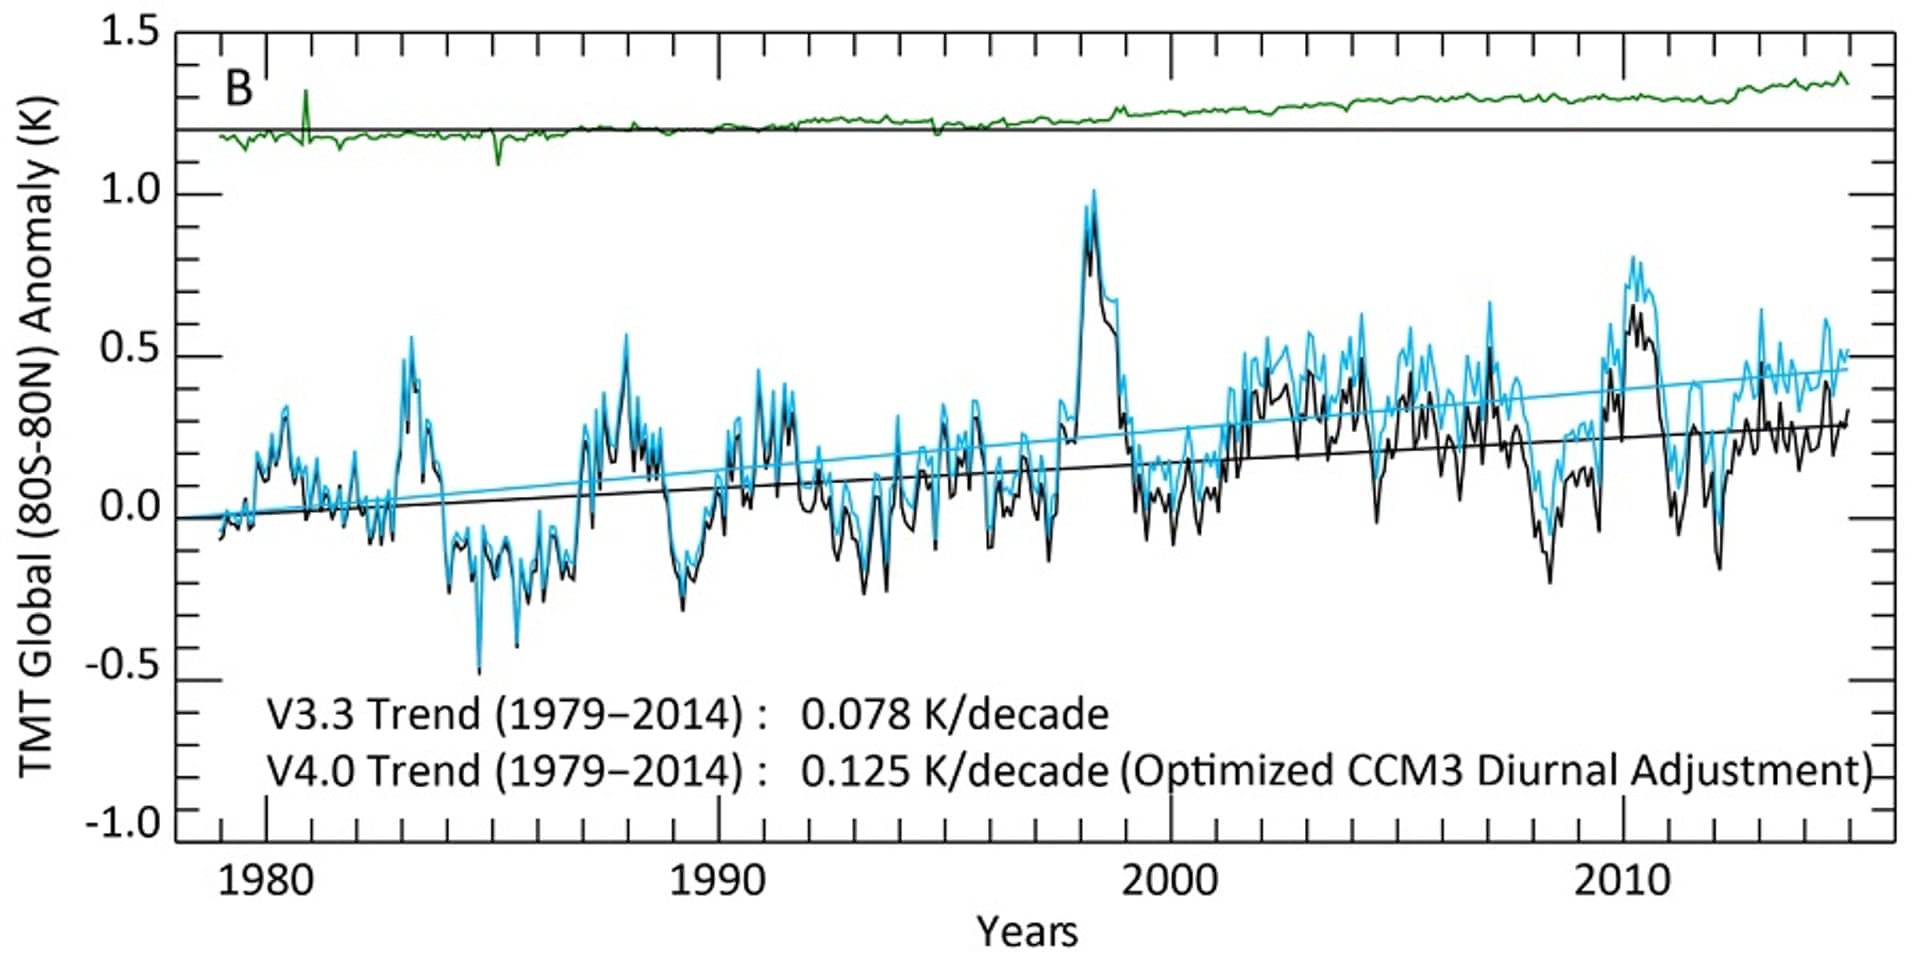
And Dr Carl Mears in now under fire for not calibrating his sensors correctly and his shoddy math... His corrections are now being shunned by most every credible scientific body on earth..