
Billy_Bob
Diamond Member
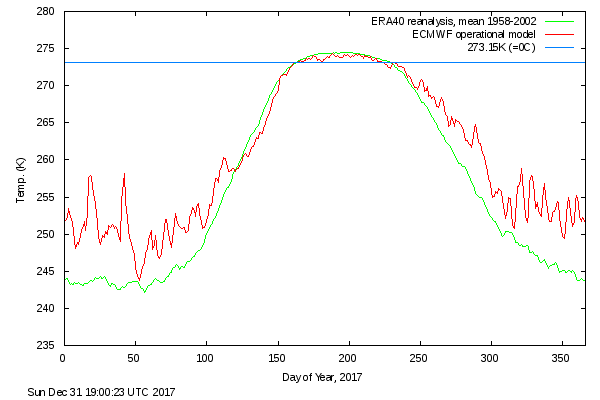
Do you know why DMI STOPPED with its 30% or greater ice levels? BECAUSE THEY ARE GROWING.. The multi year ice is increasing and that simply doesn't fit your alarmist clown agenda. The data is still available and the the ice levels are still growing. It's the weak thin ice that can vary massively form one year to the next. That is why it means exactly squat!WTF you talking about? It's -30DegC at the summit of a TERRESTRIAL Ice sheet at peak Summer. And glaciers don't calve off a TERRESTRIAL Ice Sheet.
Again, there's that failing of middle school science. Flac doesn't grasp that glaciers move.
Besides check the DMI plots it show APPRECIABLE growth INLAND and some loss at the coasts.
I really tried to dumb it down to a point where even you could grasp it. I failed. I'll try again.
That DMI image shows how much the ice would have grown IF IT HADN'T FLOWED AT ALL. It _did_ flow, hence ice was lost.
Tough shit SquidWard. That's the current weather report from Greenland. It's NOT melting.. It's REGENERATING quickly last couple years.
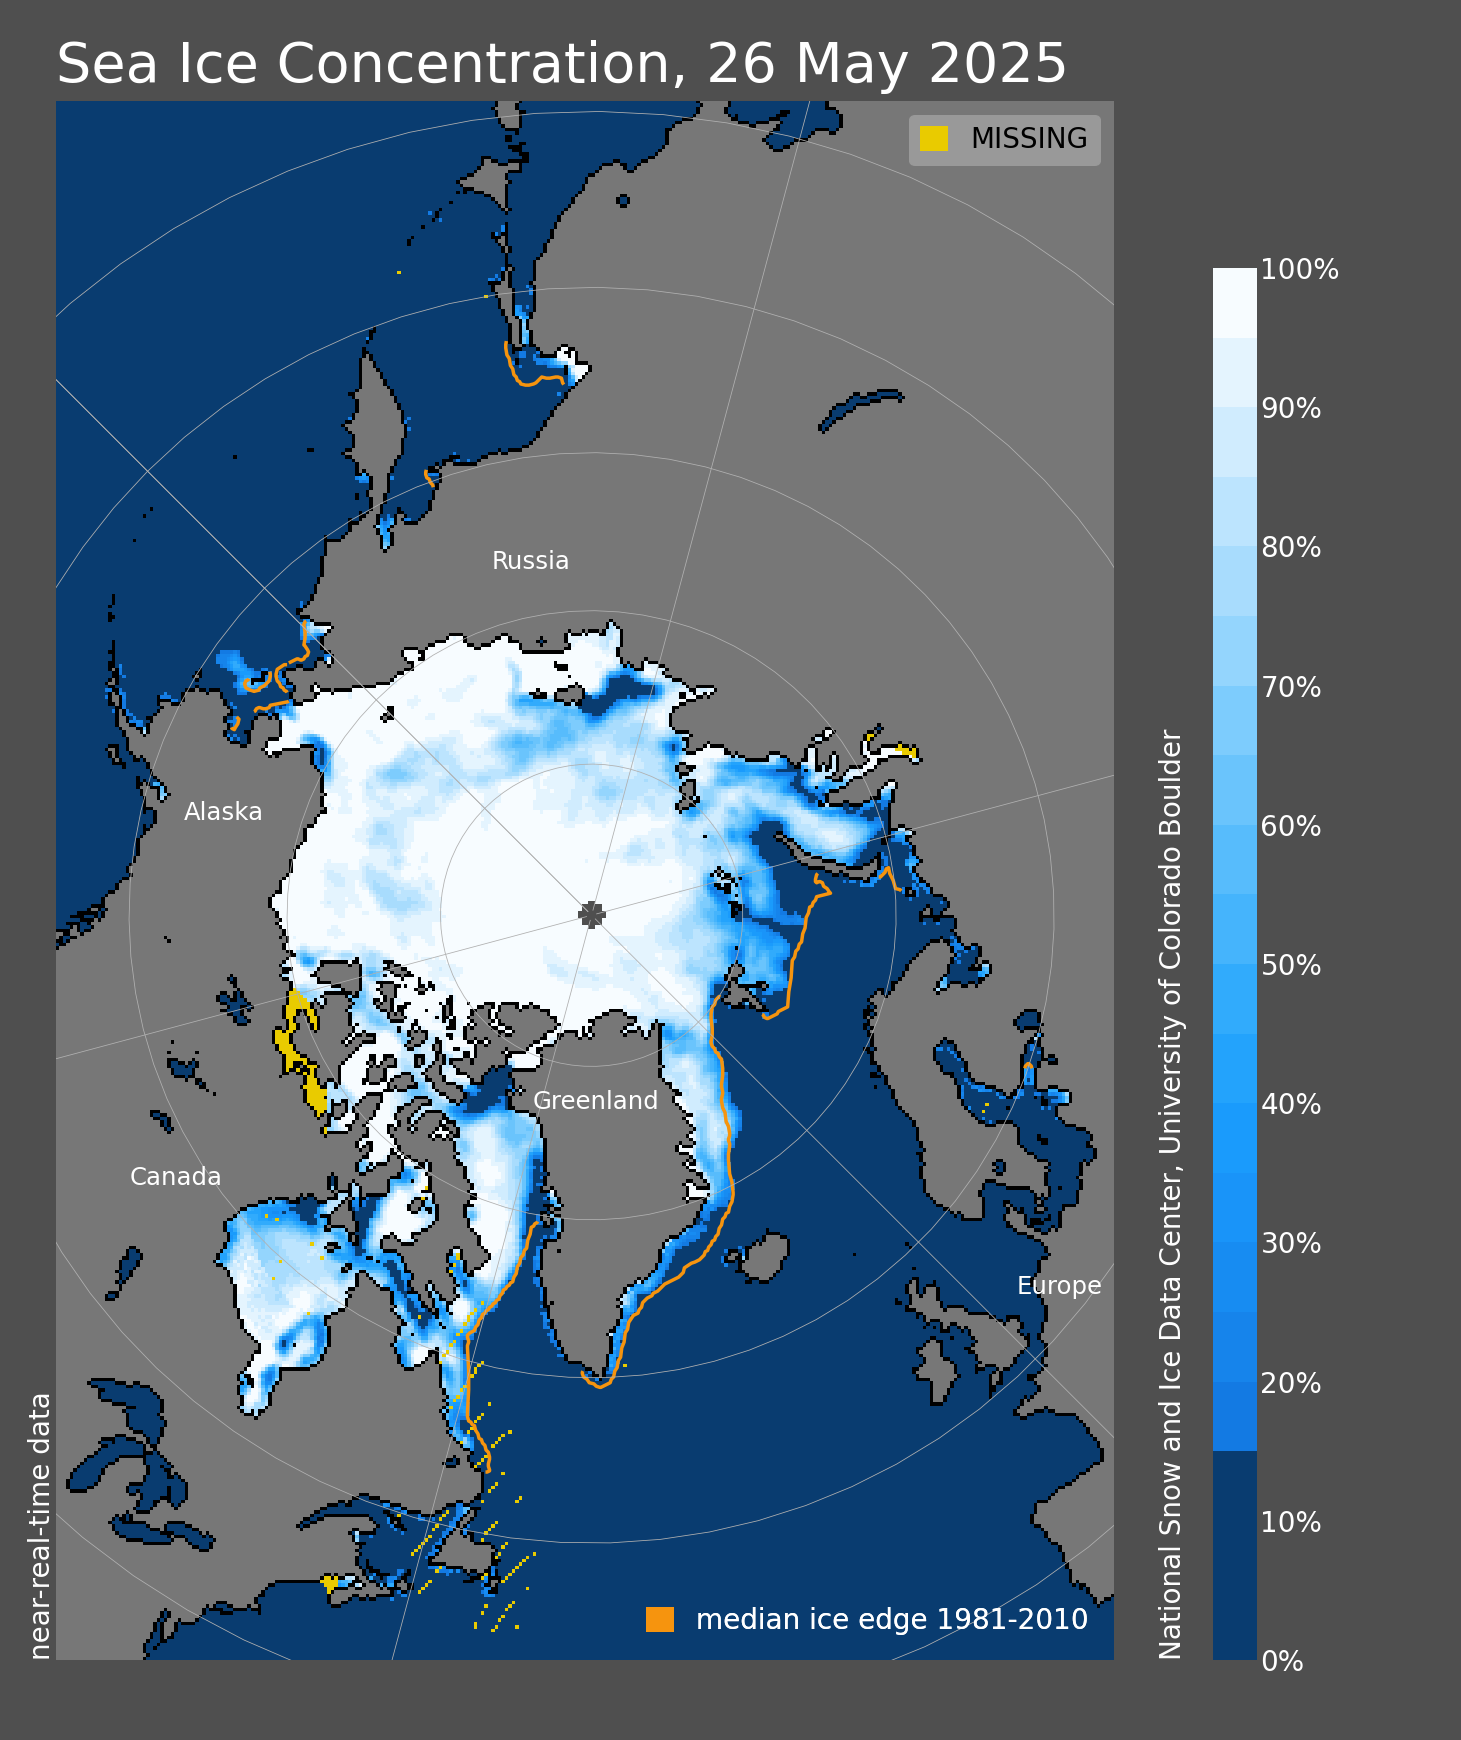
The satellite measurements say the opposite. Ice is increasing a bit in the middle, due to increased snowfall, but ice is dropping fast along the coasts.
Total mass change: Polar Portal
But then, that's just hard data, so it can't hope to compete with your religious beliefs.
Do you know how much 30% ice has increased in the Arctic the last three years? Let see if your smart enough to figure it out... {hint: its greater than 3% this year alone}
Last edited:


 Long Islanders are all beach people........but in recent years are scratching their heads in summer.
