Old Rocks
Diamond Member
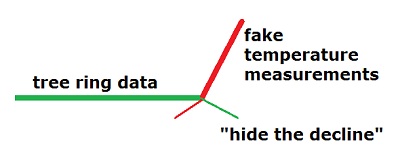
Which Hockey Stick? There are over a dozen of them now, and all show the same thing. A very dramatic upswing of temperature in the last 150 years. Here are a few of them;
CHRIS MOONEYMAY 10 2013, 11:34 AM ET

The Hockey Stick The Most Controversial Chart in Science Explained - The Atlantic
CHRIS MOONEYMAY 10 2013, 11:34 AM ET
The Hockey Stick The Most Controversial Chart in Science Explained - The Atlantic