Navigation
Install the app
How to install the app on iOS
Follow along with the video below to see how to install our site as a web app on your home screen.

Note: This feature currently requires accessing the site using the built-in Safari browser.
More options
You are using an out of date browser. It may not display this or other websites correctly.
You should upgrade or use an alternative browser.
You should upgrade or use an alternative browser.
The Real Estate Bubble officially began in 1970
- Thread starter william the wie
- Start date
william the wie
Gold Member
- Nov 18, 2009
- 16,667
- 2,402
- 280
- Thread starter
- #42
Yes, it's obviously more complicated than that but rather than sound like a know it all smart ass let me point out some media problems with Kindleberger's analysis.Leon Juglar wrote several volumes on this subject. James Grant tried to popularize the theory and in my opinion failed so here comes my attempt and may God have mercy on your brain as you try to follow me.Fair enough.
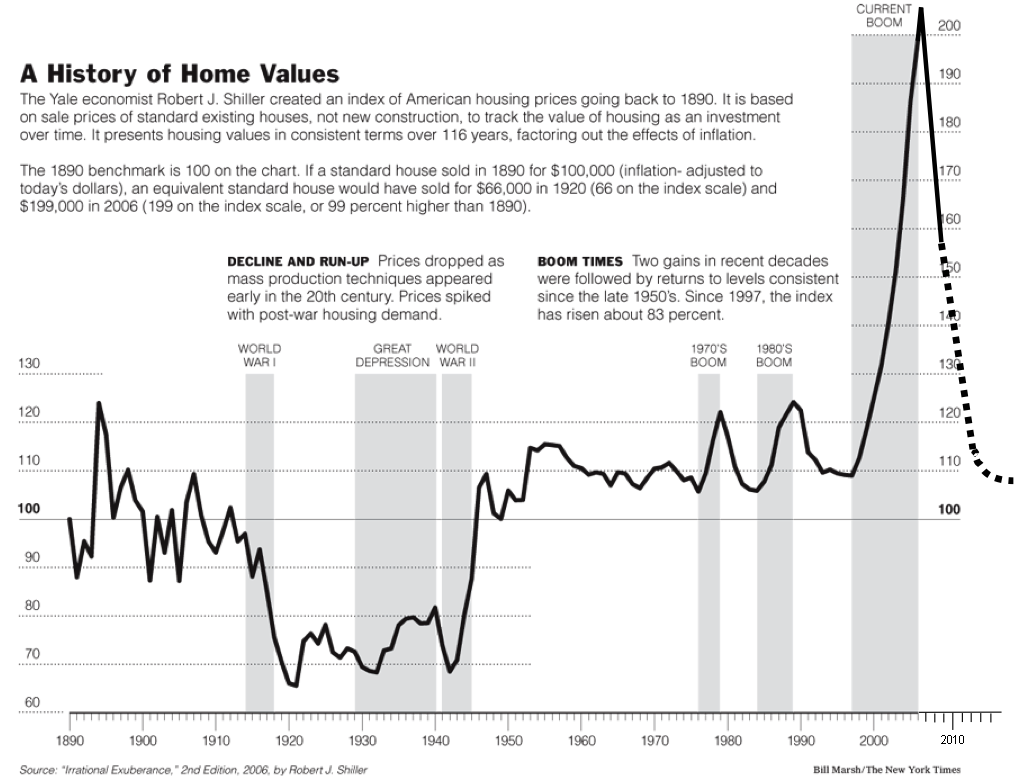
However, if the price of something stays constant, as Shiller's graph demonstrates, and the quality improves, as you are arguing, that's not inflation, that's deflation. So how can you have a bubble during deflation?
In any major innovation economies of scale, scope and network are found in distribution, production and supply chain. These discovered economies create areas of increasing marginal returns that do not fit into standard micro-economic models nor macro-economic models. Such economies are found again and again in highly innovative industries such as IT, aerospace and so on. This causes overbuilding of capacity as seemingly lunatic strategies pay off again and again until everybody's brain stops functioning and a deflation driven bubble results. Examples would include this era's dotbomb, telebomb and housing finance or in the 1920s cars, radio and film.
The obvious error is in the standard model of innovation which does not permit increasing marginal returns due to the continuous discovery of new economies right up to the point of market saturation and subsequent bust. Add in structural and financial leverage failing safe with dismaying regularity and deflationary bubbles and busts as in the 1800s become understandable. What they don't become is something you can model.
I've read stuff on this. I think this is part of Kindelberger's theory of asset bubbles.
Innovation, particularly that which dramatically shifts the cost curve downward, "fools" investors into believing the increased ROE is permanent, leading to over-investment. This innovation is seen to be wondrous and permanent, a new era. An asset bubble results but eventually, the laws of supply and demand reassert and the result is deflation as over-investment in the new paradigm leads to oversupply.
I guess as it pertains to the housing market, you're saying that this paradigm shift started in 1970, and the seeds of this new technology finally manifested this decade?
Kindleberger's analysis was limited to the math tools concepts he could reasonably expect his audience to use with relative facility without feedback. That is much, much harder than posting on a board like this I can make reference to catastrophe and chaos theory and respond within a day to any WTF queries about what I am writing. Within the straight jacket of book publishing that is not possible.
Kindleberger could not go into the strange attractors of innovative industrial linkages in a new or rebuilt industries. For example all components of any product have their own unknown economies at higher levels of production involving the building of new facilities or better organization. Ns! (supply component economies) and Nd! (distribution link economies) create common denominator sweet spots that act as chaotic strange attractors. The production manager(s) does not know why his costs get lower at lots of 1000, 3025, 4008 and so on in an innovative industry much less why at 12,072 costs really drop like a rock. All he knows is that he isn't in Ricardo land any more and he ain't got no silver slippers to get off this yellow brick road.
It's really hard to sound like a scholarly researcher making statements like the above. Because let's face it when you find yourself in a cost catastrophe of falling input prices the mind trips out. When prices crash at my example of 12,072 units price slashing stimulates a big increase demand but instead of finding yourself at the expected happy place of lowest costs at 24,144 units adding up the discounts from the suppliers plus discounts from distributors creates an even happier place at 25,304 units. This goes on until sustainable market saturation is a distant memory vaguely visible in the rearview memory and a shake out results.
So finally the survivors find themselves back in Ricardo land until the lower number of firms put them back on that damned yellow brick road that bears no resemblance to microeconomics 101. I think the 1994-2006 was the third trip to the yellow brick road for housing and by that time Thorazine, Lithium and Prozac were in a bull market too.
Last edited:
Trajan
conscientia mille testes
Gee, I don't know William. It looks to me like things got out of hand this decade.
frankly looking closely at the chart it looks the discussion of and repeal of glass-steagall ramped it up. (1999)
It had to be an advent in the securitization industry. Glass Steagal was specific to the firewall between investment and commercial banking.
Clinton signed the "repeal" of GS in late 1999. The chart begins it's vertical ascent in 1997. That more closely coincides with the growth of the derivatives markets. Most likely CDOs. But I am just guessing. I have no idea.
In any case the low interest rates that began in 2002 would be the expected cause of such a spike, but somehow the data doesn't match well.
Maybe a combo of the excess dot com liquidity and later the low interest rates had a seamless effect on driving RE prices like a rocket.
Or it could have just been that homes were significantly more value added and larger, like super sized, after 1997 while external factors played minor roles in the escalation of prices.
No I think thats pretty much right, I think they knew that Glass which was in discussion in comm. had a real a good chance to go down, and CDO's in their opinion were 'perfect' vehicles for spreading the risk.
I also remember reading that moodys wasn't exactly on board with CDO's and advancing risk assessment ie ratings, but when Glass went down they threw in the towel and went along for the ride. They never got the comeuppance they deserved either.
Having lived through these times as one of the early baby boomers, the OP premise makes no sense to me. We had a difficult time getting a mortgage for a mere 18K in the seventies. If we wanted to trace back bubbles we'd need to go back to the Tulip Bubble. The only common element in bubbles is human greed and stupidity and they are limitless.
[ame=http://www.amazon.com/History-Financial-Euphoria-Penguin-business/dp/0140238565/ref=sr_1_2?s=books&ie=UTF8]Amazon.com: A Short History of Financial Euphoria (Penguin business) (9780140238563): John Kenneth Galbraith: Books[/ame]
"The Federal Reserve is a regulator. Alan Greenspan was the chief regulator for 18 years. He failed spectacularly. So did his colleagues, at the Office of Thrift Supervision and elsewhere. These facts are not obscured here. They are ignored." James K. Galbraith: Oh Please
william the wie
Gold Member
- Nov 18, 2009
- 16,667
- 2,402
- 280
- Thread starter
- #45
Having lived through these times as one of the early baby boomers, the OP premise makes no sense to me. We had a difficult time getting a mortgage for a mere 18K in the seventies. If we wanted to trace back bubbles we'd need to go back to the Tulip Bubble. The only common element in bubbles is human greed and stupidity and they are limitless.
Amazon.com: A Short History of Financial Euphoria (Penguin business) (9780140238563): John Kenneth Galbraith: Books
"The Federal Reserve is a regulator. Alan Greenspan was the chief regulator for 18 years. He failed spectacularly. So did his colleagues, at the Office of Thrift Supervision and elsewhere. These facts are not obscured here. They are ignored." James K. Galbraith: Oh Please
The blame game is nice but a whole series of innovations such as containerization of shipping, lower skill nail guns, better recipes for building block, cheap local block and truss factories to reduce shipping damage and PVC pipe led to the 70s boom and the early 80s shakeout.
Financial innovations such as mortgage futures and securitization led to the second boom that ended in the S&L disaster and RTC bailout in this country.
By 1994 supersizing housing to conform to what was now possible set off the boom that ended in the meltdown but the driving force was increased baby boom demand that financed the innovation. When demand dropped costs rose as economies were put out of reach at lower scale and scope of sales.
loosecannon
Senior Member
- May 7, 2007
- 4,888
- 269
- 48
You're trying to find just one thing to cause a spike and there isn't one, logarithmic accelerations are like that.
sort of yeah. I am not even sure if I consider Toro's chart to be credible. The somewhat ordinary topography of the chart interrupted suddenly for a sheer vertical ascent and collapse....
I do tend to think there were a half dozen causes.
I think I may have figured out what the main driver was, the beginning of the carry trade in approx 97.
But I agree with you, many drivers working in unison.
loosecannon
Senior Member
- May 7, 2007
- 4,888
- 269
- 48
By 1994 supersizing housing to conform to what was now possible set off the boom that ended in the meltdown but the driving force was increased baby boom demand that financed the innovation. When demand dropped costs rose as economies were put out of reach at lower scale and scope of sales.
very informative, very interesting. The long shadow of war again.
You're trying to find just one thing to cause a spike and there isn't one, logarithmic accelerations are like that.
sort of yeah. I am not even sure if I consider Toro's chart to be credible. The somewhat ordinary topography of the chart interrupted suddenly for a sheer vertical ascent and collapse....
I do tend to think there were a half dozen causes.
I think I may have figured out what the main driver was, the beginning of the carry trade in approx 97.
But I agree with you, many drivers working in unison.
Toro's chart is credible. It is from S&P/Case-Shiller Home Price Indices. They are the authority on home prices. It is very accurate. This housing boom started in 1997. There was a prevailing root cause of the housing boom aided by other contributing factors. That root cause was Fannie/Freddie lowered credit standards.
loosecannon
Senior Member
- May 7, 2007
- 4,888
- 269
- 48
You're trying to find just one thing to cause a spike and there isn't one, logarithmic accelerations are like that.
sort of yeah. I am not even sure if I consider Toro's chart to be credible. The somewhat ordinary topography of the chart interrupted suddenly for a sheer vertical ascent and collapse....
I do tend to think there were a half dozen causes.
I think I may have figured out what the main driver was, the beginning of the carry trade in approx 97.
But I agree with you, many drivers working in unison.
Toro's chart is credible. It is from S&P/Case-Shiller Home Price Indices. They are the authority on home prices. It is very accurate. This housing boom started in 1997. There was a prevailing root cause of the housing boom aided by other contributing factors. That root cause was Fannie/Freddie lowered credit standards.
it doesn't look credible. The absolutely linear rise and fall post 97 are inconsistent with the balance of the chart.
Did Case Shiller issue warnings about the pending housing collapse in 2004,5,6,7?
About the relaxation in lending standards?
About the abuse in the mortgage securitization industry?
Because I did. And so did 10,000 whack jobs online who still have no "credibility".
It doesn't look credible. That's all. And you can't believe any source on the internet anymore. Nobody is credible from Moodys to Case Shiller to the SEC.
asterism
Congress != Progress
You're trying to find just one thing to cause a spike and there isn't one, logarithmic accelerations are like that.
sort of yeah. I am not even sure if I consider Toro's chart to be credible. The somewhat ordinary topography of the chart interrupted suddenly for a sheer vertical ascent and collapse....
I do tend to think there were a half dozen causes.
I think I may have figured out what the main driver was, the beginning of the carry trade in approx 97.
But I agree with you, many drivers working in unison.
Toro's chart is credible. It is from S&P/Case-Shiller Home Price Indices. They are the authority on home prices. It is very accurate. This housing boom started in 1997. There was a prevailing root cause of the housing boom aided by other contributing factors. That root cause was Fannie/Freddie lowered credit standards.
I can't agree with that, since lowering credit standards is only bad from a risk vs. reward basis and the hedges with CDOs and government subsidies covered that risk. It seems that you are suggesting that the proles were too stupid to understand the risk and therefore should have been prevented from taking it, and I disagree.
I do disagree with the mechanisms implemented to negate those losses.
asterism
Congress != Progress
sort of yeah. I am not even sure if I consider Toro's chart to be credible. The somewhat ordinary topography of the chart interrupted suddenly for a sheer vertical ascent and collapse....
I do tend to think there were a half dozen causes.
I think I may have figured out what the main driver was, the beginning of the carry trade in approx 97.
But I agree with you, many drivers working in unison.
Toro's chart is credible. It is from S&P/Case-Shiller Home Price Indices. They are the authority on home prices. It is very accurate. This housing boom started in 1997. There was a prevailing root cause of the housing boom aided by other contributing factors. That root cause was Fannie/Freddie lowered credit standards.
it doesn't look credible. The absolutely linear rise and fall post 97 are inconsistent with the balance of the chart.
Did Case Shiller issue warnings about the pending housing collapse in 2004,5,6,7?
About the relaxation in lending standards?
About the abuse in the mortgage securitization industry?
Because I did. And so did 10,000 whack jobs online who still have no "credibility".
It doesn't look credible. That's all. And you can't believe any source on the internet anymore. Nobody is credible from Moodys to Case Shiller to the SEC.
True.
Recipe for Disaster: The Formula That Killed Wall Street
sort of yeah. I am not even sure if I consider Toro's chart to be credible. The somewhat ordinary topography of the chart interrupted suddenly for a sheer vertical ascent and collapse....
I do tend to think there were a half dozen causes.
I think I may have figured out what the main driver was, the beginning of the carry trade in approx 97.
But I agree with you, many drivers working in unison.
Toro's chart is credible. It is from S&P/Case-Shiller Home Price Indices. They are the authority on home prices. It is very accurate. This housing boom started in 1997. There was a prevailing root cause of the housing boom aided by other contributing factors. That root cause was Fannie/Freddie lowered credit standards.
it doesn't look credible. The absolutely linear rise and fall post 97 are inconsistent with the balance of the chart.
Did Case Shiller issue warnings about the pending housing collapse in 2004,5,6,7?
About the relaxation in lending standards?
About the abuse in the mortgage securitization industry?
Because I did. And so did 10,000 whack jobs online who still have no "credibility".
It doesn't look credible. That's all. And you can't believe any source on the internet anymore. Nobody is credible from Moodys to Case Shiller to the SEC.
I see your point and I believe you are correct. Nearly all bubbles form a upward bending curve that climbs straight up at the end like an exponential formula similar to the right side of a parabola graph. This is caused by the froth near the end of the bubble because news of rising price has become front page & everyone wants in on the action. This is what causes the bubbles to finally pop. This happens very fast for stocks but very slow for real-estate.
They have the start & stop dates correct but they just draw straight lines from peaks to troughs. they do not plot even periodic points on their graph. The chart below provides a more accurate picture of housing prices.

loosecannon
Senior Member
- May 7, 2007
- 4,888
- 269
- 48
Toro's chart is credible. It is from S&P/Case-Shiller Home Price Indices. They are the authority on home prices. It is very accurate. This housing boom started in 1997. There was a prevailing root cause of the housing boom aided by other contributing factors. That root cause was Fannie/Freddie lowered credit standards.
it doesn't look credible. The absolutely linear rise and fall post 97 are inconsistent with the balance of the chart.
Did Case Shiller issue warnings about the pending housing collapse in 2004,5,6,7?
About the relaxation in lending standards?
About the abuse in the mortgage securitization industry?
Because I did. And so did 10,000 whack jobs online who still have no "credibility".
It doesn't look credible. That's all. And you can't believe any source on the internet anymore. Nobody is credible from Moodys to Case Shiller to the SEC.
I see your point and I believe you are correct. Nearly all bubbles form a upward bending curve that climbs straight up at the end like an exponential formula similar to the right side of a parabola graph. This is caused by the froth near the end of the bubble because news of rising price has become front page & everyone wants in on the action. This is what causes the bubbles to finally pop. This happens very fast for stocks but very slow for real-estate.
They have the start & stop dates correct but they just draw straight lines from peaks to troughs. they do not plot even periodic points on their graph. The chart below provides a more accurate picture of housing prices.
in your chart housing prices begin their vertical ascent in 2003, not 97. At least in LV.
Much more in line with my original expectation that the low interest rates following the 2002 dot com collapse caused the spike.
But I am still just guessing. Thanks for the info.
THE LIGHT BLUE BARS ON THE GRAPH ARE THE TOTAL USA HOUSING MARKET. THE DARK BARS ARE FROTH IN LAS VEGAS NEVADA.
That vertical ascent in 2003 was the frothy end of the bubble that started well before in 1997. By 2004 HGTV & flipping homes was mainstream & everyone wanted in. The airwaves were flooded with ads for Home Depot, Flipping Houses, Realtors, Consolidate Debt into Home Equity Loans. People had gone crazy on housing. Investment scammers were out in force selling financial plans that took all the equity out of homes via low interest less than interest payment loans that rolled monthly payments back into the loan (pick-a-pay loans) & invested all equity & those payments into insurance VULs that earned more money from stock market than the loan cost monthly. People were leveraging their homes to the max to maximize their earnings potential. The silliness started by subprime had gone main stream.
I saw it comming well before 2004 & sold all 4 of my rental houses in late 2005 & early 2006. My family thought I had lost it. It took longer than I thought for things to unravel and for a year I felt I must have sold to soon, but with something as big as the entire housing market it is like steering a big ship. I sold just 6 months before the peak but in that time flippers had managed to sell those homes I sold them & made more money. Prices were truly going verticle at that point. I have now bought 4 more homes over the past year for the price I sold 1 for in 2006.
Here is how you know the government Fannie/Freddie was the cause. The same greedy bankers & investment scammers made & refinanced farm loans as well. To date I have not found that a single farmer has been foreclose on even as their income & crop prices have dropped.
Last edited:
william the wie
Gold Member
- Nov 18, 2009
- 16,667
- 2,402
- 280
- Thread starter
- #55
KissMy, if you want a better apologetic try checking out "High Wire" by Peter Gosselin. Your analysis was and is correct but there is a broad base of data supporting your position that you are not using.
Instability of income increased from 1970 on as did consumer debt loads. This was concealed by massaging the data from one end of the economy to the other.
Net Investment, the main driver of economic growth per capita, has been cooked since 1958. This is done by not properly adjusting physical depreciation for inflation in preceding years.
UE has been continuously redefined since the Reagan administration.
The CPI has an extremely long list of readjustments that go back forever.
Other indices such as Case-Shiller have material omissions such as the increasing size and amenities of the houses built and sold in 1994-2006. 2000 sq. ft. with a minimum of two bathrooms was not the median house of the 1960s try 1000 sf and 1.5-1.75 baths w/o central AC and/or in the south heat.
"High Wire" does not cover everything but it does cover a lot of the changes and does so better than most of the works I have seen.
asterism
Congress != Progress
KissMy, if you want a better apologetic try checking out "High Wire" by Peter Gosselin. Your analysis was and is correct but there is a broad base of data supporting your position that you are not using.
Instability of income increased from 1970 on as did consumer debt loads. This was concealed by massaging the data from one end of the economy to the other.
Net Investment, the main driver of economic growth per capita, has been cooked since 1958. This is done by not properly adjusting physical depreciation for inflation in preceding years.
UE has been continuously redefined since the Reagan administration.
The CPI has an extremely long list of readjustments that go back forever.
Other indices such as Case-Shiller have material omissions such as the increasing size and amenities of the houses built and sold in 1994-2006. 2000 sq. ft. with a minimum of two bathrooms was not the median house of the 1960s try 1000 sf and 1.5-1.75 baths w/o central AC and/or in the south heat.
"High Wire" does not cover everything but it does cover a lot of the changes and does so better than most of the works I have seen.
Interesting thing about those "consumer debt loads." So we're talking about people who actually did agree to go into debt correct?
Trajan
conscientia mille testes
I think its worth noting that there is/was an underlying philosophy that drive this all from the creation of the CRA up to the last implosion ( with F&F waiting in the wings to implode next)...thats the outlook that everyone ought to be able to own the largest of consumer asset purchases- a home.
Its never been true, will never be true. Money is just so cheap and only so many of any given population will be in position to afford one.
The rest is all window dressing, wall st and the banks knew, but they are smarter when they sleep than the yahoos running the gov. and they ( well a huge portion of them) weren't going to get caught holding the bag.....the politicos shift blame, leaving you know who on the hook.
Last edited:
asterism
Congress != Progress
I think its worth noting that there is/was an underlying philosophy that drive this all from the creation of the CRA up to the last implosion ( with F&F waiting in the wings to implode next)...thats the outlook that everyone ought to be able to own the largest of consumer asset purchases- a home.
Its never been true, will never be true. Money is just so cheap and only so many of any given population will be in position to afford one.
I can't agree with that. One of the first things I noticed when paying rent was that I could pay the same amount and actually own the property. However, I treated by mortgage payment like my rent payment - as in I will get evicted if I don't pay. I think that was where this whole system broke down, people not getting kicked out of houses for not paying.
william the wie
Gold Member
- Nov 18, 2009
- 16,667
- 2,402
- 280
- Thread starter
- #59
Quite true but a bigger factor by far was what in effect ex post facto changes in bankruptcy laws first in education loans and later for a long laundry list of loans. Another major factor was doing away with jury nullification. Loans made to legal infants, the mentally incompetent and others who could not understand the contracts they signed were no longer voided by juries. Current American debt laws in effect create peonage.I think its worth noting that there is/was an underlying philosophy that drive this all from the creation of the CRA up to the last implosion ( with F&F waiting in the wings to implode next)...thats the outlook that everyone ought to be able to own the largest of consumer asset purchases- a home.
Its never been true, will never be true. Money is just so cheap and only so many of any given population will be in position to afford one.
I can't agree with that. One of the first things I noticed when paying rent was that I could pay the same amount and actually own the property. However, I treated by mortgage payment like my rent payment - as in I will get evicted if I don't pay. I think that was where this whole system broke down, people not getting kicked out of houses for not paying.
I can't agree with that. One of the first things I noticed when paying rent was that I could pay the same amount and actually own the property. However, I treated by mortgage payment like my rent payment - as in I will get evicted if I don't pay. I think that was where this whole system broke down, people not getting kicked out of houses for not paying.
You are right about that. People discovered they could now get a no down subprime loan & not make a payment for over a year before they got evicted. Now they are going 2-3 years before eviction. People working & paying rent & mortgage payments made the economy go round. Monthly rent, mortgage, tax & insurance payments employed only American workers & money stayed here at home.
Similar threads
- Replies
- 33
- Views
- 706
- Replies
- 12
- Views
- 327
- Replies
- 431
- Views
- 7K
- Replies
- 46
- Views
- 2K
Latest Discussions
- Replies
- 334
- Views
- 2K
- Replies
- 8
- Views
- 17
- Replies
- 95
- Views
- 420
Forum List
-
-
-
-
-
Political Satire 8015
-
-
-
-
-
-
-
-
-
-
-
-
-
-
-
-
-
-
-
ObamaCare 781
-
-
-
-
-
-
-
-
-
-
-
Member Usernotes 466
-
-
-
-
-
-
-
-
-
-