william the wie
Gold Member
- Nov 18, 2009
- 16,667
- 2,402
- 280
An explanation first. On another board an annoying poster was rehashing the CRA to prove that the Dems caused the bubble and bust.
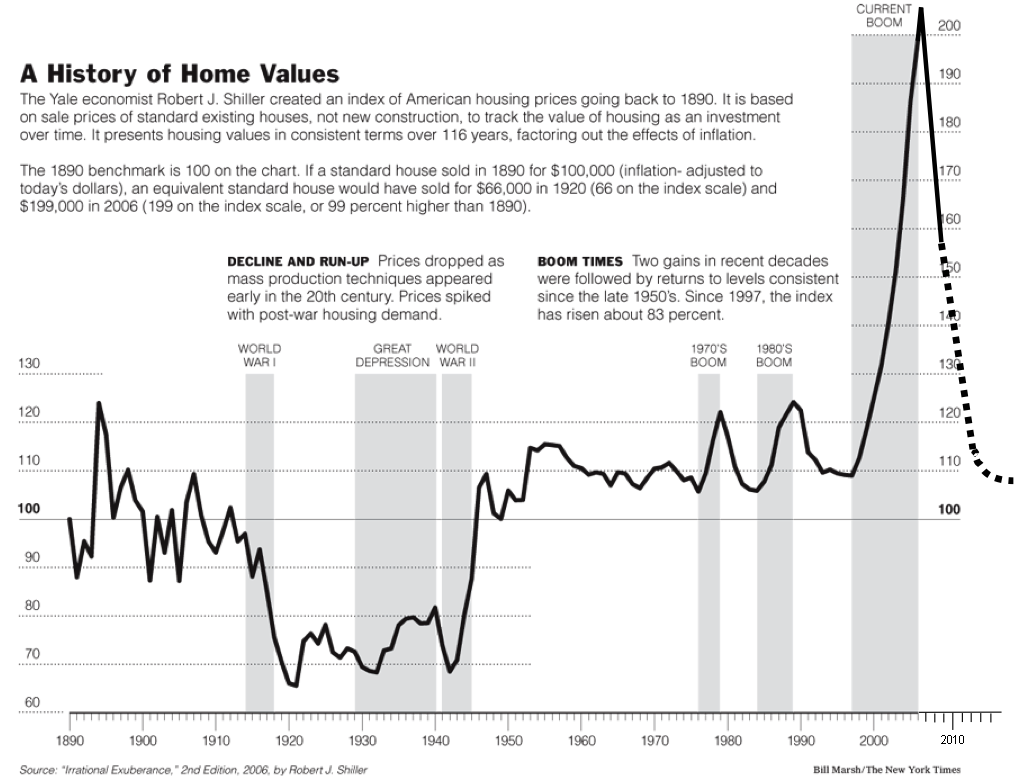
So anyhow I started a thread that pointed out according to Case-Shiller the start of the bubble was in 1994. But something about that number bugged me. I started looking through my bookcases and ran across "Paper Money" from 1981. The book published under the pseudonom "Adam Smith" had a chart I vaguely remembered from the Federal Reserve Board that dated the housing bubble's beginning to 1970. (No links I'm afraid.)
So here's the problem if the 1943 furlough babies, the leading edge of the Baby Boom, started a bubble in 1970 at age 27 and it ended when the trailing edge of the Baby Boom, 1964 birth year, began hitting 52 then when the 1982/3 start of Generation Y hits 27 the housing bust will hit bottom and turn around. That will be 2019/20. The Bubble had many interruptions such as the S&L crisis of the 1990s and the ongoing bust has had and will have many interruptions but no economic policy will stop or even seriously slow down the decline prior to about 2020.
That should have a lot of effects on economic policy and I was wondering what other people on this board thought they might be.