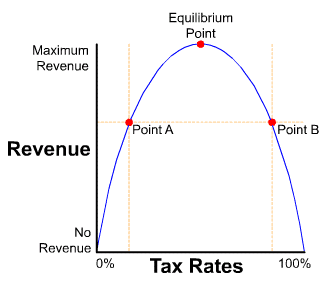
The Laffer Curve Bends at an 80% Rate of Income Tax

yes I understand that, and the next questions begs to be asked; so why then after what, say 60 years as you said there has not been a study, model data set generated for the US that either proves or disproves the issue?


and, so let me ask you a question; do you think they should allow the cuts to expire?

There have been several studies that have disproved this. I linked them above, at least the ones that come from Republican economists. What I'm saying is that I have never seen any studies that have proven that the US economy is on the left hand side of the Laffer Curve. I don't think Arthur Laffer himself ever published a paper proving his thesis. If I recall correctly, it was merely a theory.

That applies to US income tax rates. There is empirical evidence that cutting corporate tax rates and royalty rates on natural resources does generate more than enough economic growth to offset the loss in revenues from those tax cuts. There is also evidence that in third world countries with high tax evasion, cutting taxes along with increased penalties for tax evasion increases revenues. But there has never been any empirical evidence, at least that I'm aware of, which proves this to be the case for US income tax rates. Yet it is deeply embedded within mainstream Republican and "conservative" thinking, as you can see in this thread. I think its the biggest intellectual fraud in the political-economy over the past 30 years.
 
Oh, and your second question, I think they should allow the tax cuts to continue for as long as the economy is weak. I don't think the tax cuts should be allowed to expire until the economy strengthens. Then, they should be allowed to expire, unless the government cuts spending. If the government does not cut spending, I think its insane to allow the Bush tax cuts to continue.

From my understanding, the Bush tax cuts were poor policy, a hodgepodge of politically popular tax cuts doing little to increase near-term economic growth, which is what they were sold as. I very much like most of the ideas in this new Deficit Reduction Committee. Lowering rates while broadening the tax base and reducing deductions is good economics. The Committee's recommendations were $3 in spending cuts for every $1 in taxes raised. I think that's about right.
 
Last edited:
Oh, and your second question, I think they should allow the tax cuts to continue for as long as the economy is weak. I don't think the tax cuts should be allowed to expire until the economy strengthens. Then, they should be allowed to expire, unless the government cuts spending. If the government does not cut spending, I think its insane to allow the Bush tax cuts to continue.

From my understanding, the Bush tax cuts were poor policy, a hodgepodge of politically popular tax cuts doing little to increase near-term economic growth, which is what they were sold as. I very much like most of the ideas in this new Deficit Reduction Committee. Lowering rates while broadening the tax base and reducing deductions is good economics. The Committee's recommendations were $3 in spending cuts for every $1 in taxes raised. I think that's about right.

:clap2:

That is in theory the way the Keynesian model is supposed to work. However they never really cut spending even when they say they have. They just raid the pension funds, social security, medicare & secretly print money. Also politics & not monetary policy change the tax rates, so getting taxes to rise during heated economic bubbles & decrease during recessions is pure fantasy. Even if tax policy was regulated like monetary policy the government would still get it wrong. They are so wrong that I sometimes believe they are doing it on purpose.

[ame="http://www.youtube.com/watch?v=V5sDKwMP6Pc"]Proof Government is Wrong on Purpose.[/ame]

Ireland 2010 Tax Calculator shows about 50% federal tax rate & they are still going bankrupt.
 
Last edited:
Here is another study.

We compare Laffer curves for labor and capital taxation for the US, the EU-14 and individual European countries, ... The US can increase tax revenues by 30% by raising labor taxes and by 6% by raising capital income taxes. For the EU-14 we obtain 8% and 1%. ... for the EU-14 ... 54% of a labor tax cut and 79% of a capital tax cut are self-financing. The Laffer curve in consumption taxes does not have a peak. Endogenous growth and human capital accumulation locates the US and EU-14 close to the peak of the labor tax Laffer curve. ... By contrast, transition effects matter: a permanent surprise increase in capital taxes always raises tax revenues.

http://ideas.repec.org/p/nbr/nberwo/15343.html
 
...I have never seen any studies that have proven that the US economy is on the left hand side of the Laffer Curve...
That may be saying more about what you're demanding as proof than what history shows. Somehow I'd have thought that if tax rate cuts were followed by increased revenue, and it happened with each major cut in rates over several decades, that the inverse correlation would by definition trace the right side of the bell curve.
 
That is the conclusion made by three economists who looked at a highly-mobile group of top earners - professional soccer players - who earn a high amount in a short period of time and thus should be highly sensitive to income tax rates.

High earners are internationally mobile, and so will emigrate if taxes are too high. Because of this, tax increases actually reduce revenue. So goes the standard rightist claim. However, a new paper (pdf) suggests it is plain wrong. Henrik Kleven, Emmanuel Saez and Camille Landais have studied the response of professional footballers in Europe to tax rates. And they’ve concluded that the revenue-maximizing tax rate upon them in England is over 80%.

Yes, there is a Laffer curve - it’s just that we are on the left of it.

This is not because top footballers don’t leg it when faced with higher taxes. They do. The authors estimate that a rise in the top tax rate of 10 percentage points reduces the probability of a foreign player joining that country’s league by four percentage points. ...

This mobility, though, is not sufficient to justify low taxes. The reason for this is simple. If a high-ability player leaves, he’ll be replaced by lower-ability one; when Cristiano Ronaldo flounced off to Spain, [Manchester United] did not field just 10 players. This displacement effect means the loss of tax revenue is far smaller than the loss of the top player would suggest. The upshot is that revenue-maximizing tax rates are high. ...

A footballer’s career is short. So he does not have the option, which other workers do, of postponing retirement in order to make up for a loss of post-tax income. For footballers, then, substitution effects dominate income effects in a way that is not true of other workers.

Secondly, footballers - especially from smaller countries - are accustomed to having to move country. So they are more mobile than other workers.

On the other hand, though, there’s a big difference arguing the other way. Football must be located in England. Fans expect Arsenal to be based in London, not in Basle. But the same is not true for the hedge fund industry. It could move overseas in its entirety. This argues for lower taxes.

However, as demand for £1 million houses has risen sharply in the last year, and prices of prime London property are rising, it’s not obvious that the new 50p tax rate is, so far, reducing the rich’s inclination to live in England.

What’s more - of course - revenue maximization is not the only criteria here. The authors find that higher taxes do reduce the quality of a country’s football league by driving out some of its top players. And there are, of course, also arguments that huge taxes reduce freedom.

Nevertheless, the fact is that complaints that higher taxes will backfire and produce less revenue are highly dubious.
Stumbling and Mumbling: Laffer curves for footballers

Can these so called economists show me exactly how much money these soccer players are actually paying in income tax? I know for a fact that most countries do not tax any income earned outside of their borders, even if the person who earns it actually lives in that country. Being highly mobile, and having access to some very smart tax advice, my guess is that those soccer players are not actually getting taxed at 80%.
 
...I have never seen any studies that have proven that the US economy is on the left hand side of the Laffer Curve...
That may be saying more about what you're demanding as proof than what history shows. Somehow I'd have thought that if tax rate cuts were followed by increased revenue, and it happened with each major cut in rates over several decades, that the inverse correlation would by definition trace the right side of the bell curve.

Please show evidence of causality that we are on the right side of the Laffer Curve. Any evidence. Thanks.

And the economies with 80% tax rates, they're they world's largest, right?

Different issue.
 
There are several begged questions in this thread:

The biggie is that the so called Laffer curve goes back at least a century it was used by Treasury Secretary Mellon to justify tax cuts in the 1920s and it was derived Leon Juglar's study of panics in the 1890.

The Laffer curve argument is that there is a unique singularity in the individual income tax curve of maximum revenue regardless of other taxes. This is absurd on many levels. If there are multiple tax streams then the optimal income tax level changes. Assuming DC is subject to rounding errors and there are multiple taxes then are strange attractors in the mix.
 
...Please show evidence of causality that we are on the right side of the Laffer Curve...
We need to be talking about the same thing. The Laffer model points out that no revenue is raised by either zero tax rates or 100% rates, and that an optimum exists somewhere between:
laffer.gif

If we don't accept the Laffer model then we don't believe there's a causal affect. If we do accept the model than we decide that rate changes affect revenue, and that the direction of a change in revenue after a major change in tax rates is all that's needed to show where we are. I'm willing to work with you on checking together how the model corresponds to historical fact.

There are a few flaws with the theory. First, communist governments took everything and generated more than zero. I think it's pretty fair to say that the commies are on the right side of the curve. However, revenue isn't zero either. Second, there is no reason to assume the curve is symmetric. Finally, it assumes that productivity and work are a function only of tax rates. This isn't true.

The argument that I have isn't that there is no Laffer Curve of some affect. There is. What I argue is that many on the right assume that always cutting taxes raises revenues and always raising revenues won't increase revenues, and that there is zero evidence of this. As I linked above, Republican economists don't believe it either. But the rank and file believe it with a religious intensity.
 
...There are a few flaws with the theory. First, communist governments took everything and generated more than zero...
Models don't have 'flaws' they have limits. Communists don't pay taxes so the Laffer model doesn't apply.
 
...There are a few flaws with the theory. First, communist governments took everything and generated more than zero...
Models don't have 'flaws' they have limits.

Semantics

Communists don't pay taxes so the Laffer model doesn't apply.

I see what you are getting at but it contradicts your argument. I will post something later demonstrating why.

However, it applies. Whether it is in taxation or extracting value by suppressing the market price of labour by dictating wages, both are a transfer of labour productivity away from the labourer to the government and theoretically should have the same affect on incentives.
 
...it applies. Whether it is in taxation or extracting value by suppressing the market price of labour by dictating wages, both are a transfer of labour productivity away from the labourer to the government...
Please tell me if you're talking about the standard Laffer model--
laffer.gif
--becuase if you are then you have to not only quantify the taxation rates implied by "suppressing the market price of labour by dictating wages", but also quantify the resultant implied revenue that results if we move "productivity away from the labourer to the government".

Sure we all know it can be done, but the big question is whether we can do it without laughing hysterically.

Say you're a doctor and a doctor is worth $500,000. If the government taxes you at 90% or the government has socialized medicine and will not pay you more than $50,000 a year (tax free!) the effects are the same.

Right, crappy socialized medicine either way
 

Forum List

Back
Top