The Himalayas and nearby peaks have lost no ice in past 10 years

PS....the global warming k00ks never want you to know that ALL glaciers melt somewhat in summer since forever........thus, when these deceitful AGW bozos' post up before and after photo's, one will notice it doesn't indicate the season the photo is taken.

Would you REALLY like to suggest this is seasonal melt?

38_4_c365-6-l.jpg


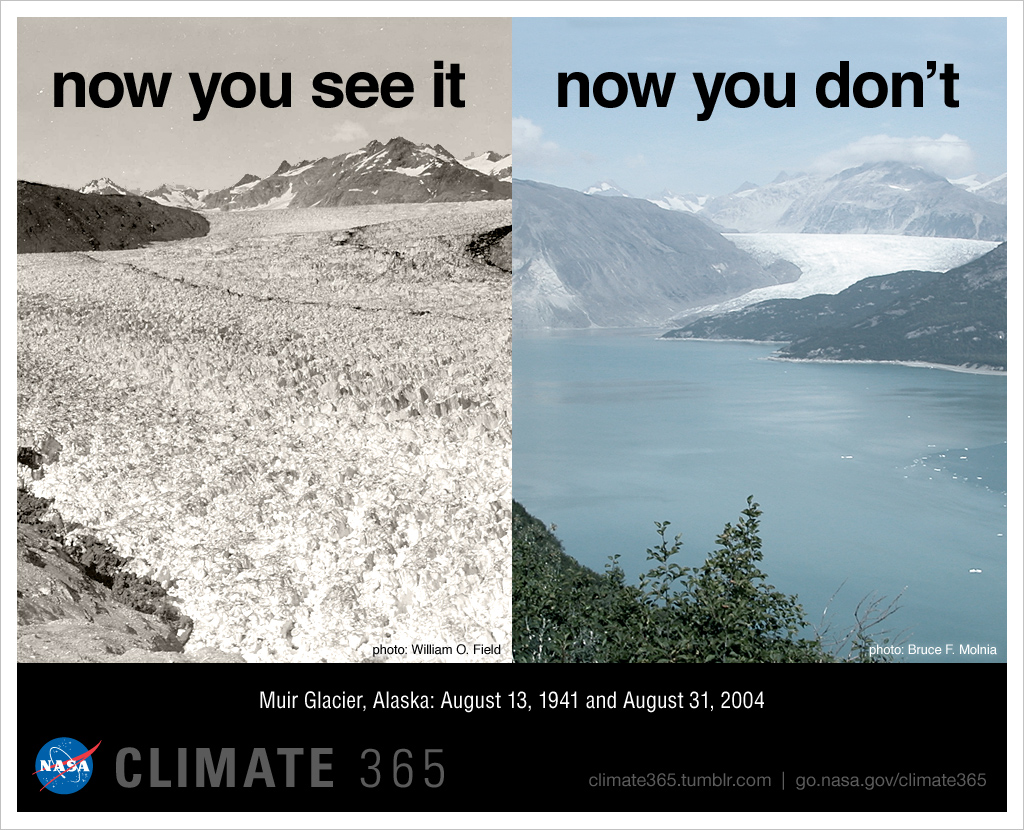
Let's make an estimate: I'm gonna say the missing ice there is (VERY conservatively) 1,000 feet deep, a half mile wide and a mile long. That gives me a volume of 1,000 x 2640 x 5280. That's 13,939,200,000 cubic feet or 398,661,120 tons. Let's call it 400 million tons. 200 glaciers melting like this would equal your Antarctic ice gain. Do you think we've got 200 glaciers on the planet? And let's keep in mind that no one has verified Zwally. So far he's the ONLY scientist to conclude that Antarctica is experiencing net gain. I could give you a dozen that have done the same study and disagree. And Zwally himself expects the ice mass balance to go negative within the next decade.

If you think Zwally refutes AGW, you're out of your fucking minds.
 
Muir_Glacier_retreat.png


This image lets me estimate the ice lost as 12 miles long. The text also stated the glacier's width at its terminus was 0.7 km. Using the conservative 1000 foot depth, we get 4,161,637,795 tons of ice lost from this single glacier. Twenty of these have more than compensated for Zwally's fantasy.

PS: since 1982, the glacier has retreated another 1.25 miles.

STILL THINK THIS IS SEASONAL MELT?

God are you fucking stupid
 
Meanwhile, 97% of Earth ice on Antarctic and Greenland continues to grow to the tune of well over 80 billion tons of new ice added each year.

Cherry pick the warmers will. Nothing changes the truth of an ice age producing a new ice core every year...
 
That's what ice ages do, Crick. Every year, another ice core layer is added to the top of the glacier. The glacier responds to that additional weight and gravity and moves a bit. That is why the claims of Antarctica and Greenland "melting" are so laughable. Those things grow ice. That's what they do. That's ALL they do. They don't feel pity or remorse, and they will not stop "printing" "manufacturing" "accumulating" (take your pick) new ice cores every year until tectonics moves them away from the pole....
 
The Himalayas and nearby peaks have lost no ice in past 10 years


that is certainly bad news for

the man made global warmist extremists

they must remain faithful

in such trying times

--LOL
 
The Himalayas and nearby peaks have lost no ice in past 10 years


that is certainly bad news for

the man made global warmist extremists

they must remain faithful

in such trying times

--LOL

But but but surely the recent temperature increase in the Antarctic from -12F to -11.5F is melting ice bekuz global manmade climate warming change, right?


for the faithful the answer is obvious -YES-

--LOL
 
The Arctic is not the Himalayas, however;

SPIOMASIceVolumeAnomalyCurrentV2.1.png


Fig.1 Arctic sea ice volume anomaly from PIOMAS updated once a month. Daily Sea Ice volume anomalies for each day are computed relative to the 1979 to 2014 average for that day of the year. Tickmarks on time axis refer to 1st day of year. The trend for the period 1979- present is shown in blue. Shaded areas show one and two standard deviations from the trend. Error bars indicate the uncertainty of the monthly anomaly plotted once per year.

Polar Science Center » PIOMAS Arctic Sea Ice Volume Reanalysis

Any ice loss in the Himalayas is due to aldebo from the soot of a newly industrialized China
 
The Arctic is not the Himalayas, however;

The warmers are left to fudge and lie about the 3% of Earth ice not on Antarctica or Greenland...

The Himalayas ice is growing...

Himalayan glaciers growing despite global warming

In reality, on Earth today, about 1% of ice is melting, the rest is growing... so that's why we get mountains and sea ice from the mouths of the hysterical fearmongering fudgebakers...
 
Last edited:
LOL.....that graph above is set up to alarm the viewer. Ghey. :gay: 
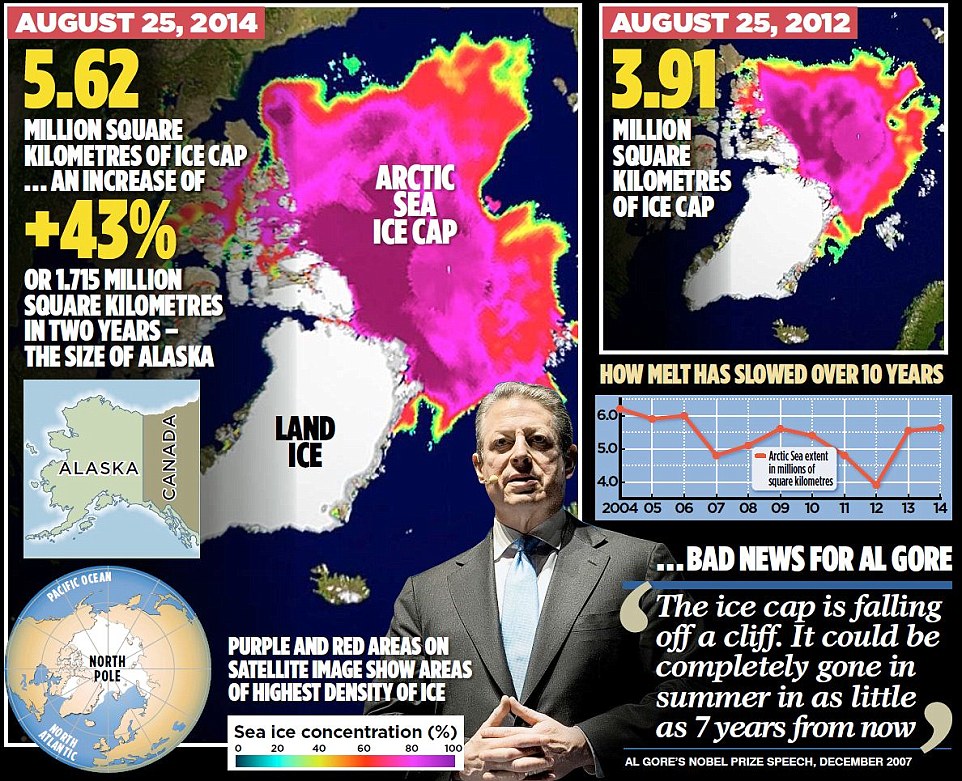
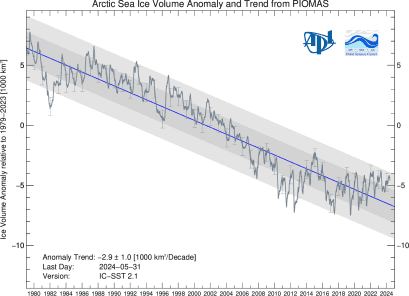
People who are smart at graphing can make things look compelling by fucking with the vertical axis.......its an old trick done by anybody who is in the business of collecting and analyzing data ( like me )!!
 
Deniers are the undisputed masters of lying-by-graph. It's not their only type of fraud, but it's one of their staple frauds, as they just proved here.

Deniers, why do you do that? We arleay know you're lying frauds. No need to reinforce that point.

ArcticEscalator500.gif
 
tp://36.media.tumblr.com/b835c0fc2b0a25b008f736419e545cf6/tumblr_inline_nnty350Cn51qij8k6_500.png


tumblr_inline_nnty350Cn51qij8k6_500.png


D'oh!!!

Unsourced fraudulent bullshit from the CrazyFruitcake.

In the real world.....

Arctic sea ice crashes to record low for June
From mid-June onwards, ice cover disappeared at an average rate of 29,000 miles a day, about 70% faster than the typical rate of ice loss, experts say
The Guardian
Suzanne Goldenberg
7 July 2016
(excerpts)
The summer sea ice cover over the Arctic raced towards oblivion in June, crashing through previous records to reach a new all-time low. The Arctic sea ice extent was a staggering 260,000 sq km (100,000 sq miles) below the previous record for June, set in 2010. And it was 1.36m sq km (525,000 sq miles) below the 1981-2010 long-term average, according to the National Snow and Ice Data Center. That means a vast expanse of ice – an area about twice the size of Texas – has vanished over the past 30 years, and the rate of that retreat has accelerated. Aside from March, each month in 2016 has set a grim new low for sea ice cover, after a record warm winter.

January and February obliterated global temperature records, setting up conditions for the further retreat of the Arctic summer ice cover, scientists have warned. Researchers said the ice pack over the Beaufort Sea was studded with newer, thinner ice, which is more vulnerable to melting. Ice cover along the Alaska coast was very thin, less than 0.5 meters (1.6 ft). The loss of the reflective white ice cover in the polar regions exposes more of the absorptive dark ocean to solar heat, causing the water to warm up. This goes on to raise air temperatures, and melt more ice – reinforcing the warming trend. Scientists have warned the extra heat is the equivalent of 20 years of carbon emissions.
 
What percent of Earth ice is Arctic Sea Ice?

An idiotic and completely meaningless question that has nothing to do with the very real consequences of the loss of Arctic ice.....a question that only reveals what an ignorant retard you are, LaDumbshit.
 

Forum List

Back
Top