The Evolution of "Manmade Global Warming"

Water vapor covers the exact same wavelengths as CO2,
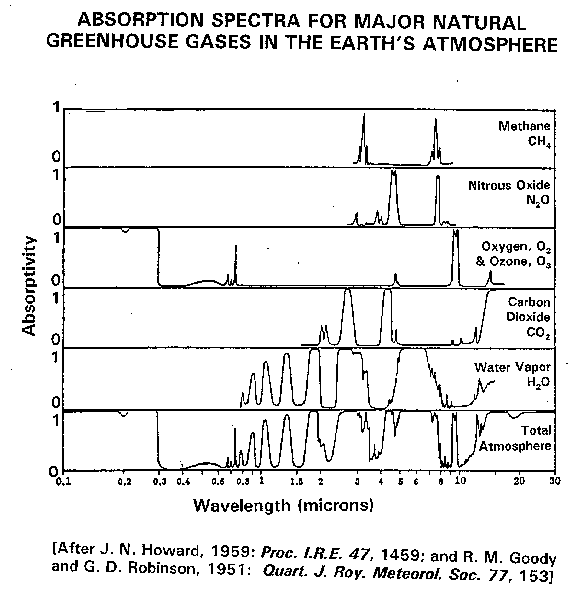
image7.gif


...clearly your knowledge on the subject is lacking. As it is for most science hating AGW [denying] religious fanatics. You guys don't "do" science. It scares you or something.
Talking to yourself like this is an indication of insanity, walleyedretard, but of course, we don't really need to see any more indications since you've already demonstrated that you're completely bonkers many times on this forum.


Wait wait wait.

The wavelength of light and short wavelength infrared CHANGES after it passes through the atmosphere.

So WHICH wavelength absorption is being measured in that handy dandy little chart? The absorption of the energy on the way down through the atmosphere or the absorption of the energy (mostly heat) on the way back up from the Earth?

I am not a scientist and don't play one on TV. But I do recognize a much greater need for precision in this discussion.

Check this out:
spectra.png


Cold Facts on Global Warming

I noticed that TinkerBelle had to go waaay back to the 1950s to find a chart that lopped off the most important bits of that relationship..

A more complete view of the overlap is shown here..

flacaltenn-albums-charts-picture3643-atmosheat.jpg


Note the bracket showing the band for the reflected surface heat.. If you want to treat the surface as a black body radiator (which it isn't really) than you want to know what happens primarily in the longer wavelengths..

SMALL SHIFTS in that reflected radiation band COULD modulate the amount of overlap in the water/CO2 absorption bands. As in changes in Albedo in the Arctic or contributing to other "sensitivities" that we observe REGIONALLY or seasonally...
 
If you wish to acquire your first few grams of credibility, you should also consider NOT making silly claims like the one you made about the charts.
LOLOLOLOLOL....oh come on, you silly retard....I said the charts showed the same thing and they do....and I asked you what your point is but I guess your only point is the one on your head.

The charts do NOT show the "same thing," you tragically pathetic idiot.

OK Mr, Retardo, here's the charts we posted. Looking at the CO2 and the H2O lines, tell us what you imagine the difference to be.

image7.gif

spectra.png
 
Good way to conclusively demonstrate that you're another brainwashed and totally clueless denier cultist - link to a bogus denier cult blog run by some unknown non-scientist and loaded with with half-assed pseudo-science. You're soooooo gullible. Here's a response from a real climate scientist.

What is RealClimate’s take on T. J. Nelson’s “Cold Facts on Global Warming”

Response: Nelson appears to base his entire argument on the 'fact' that CO2 contributes 4 to 8% of the total greenhouse effect (of 33 deg C), and therefore a doubling of CO2 can only increase the total greenhouse effect proportionatly. Apart from being wrong about the effect of CO2 (around 9 to 25% of the longwave absorbtion depending on how you calculate the overlaps (see our previous post), this is way too linear a calculation to be applicable. In particular, he assumes that water vapour amounts are independent of the temperature (they are not). There are a number of other obvious bloopers (ie. "In fact, the effect of carbon dioxide is roughly logarithmic. Each time carbon dioxide (or some other greenhouse gas) is doubled, the increase in temperature is less than the previous increase". No. Logarithmic means that the effects of doubling are constant). So in toto, it's not too impressive a thesis. See our posts on climate sensitivity (or here) for more considered information. - Dr. Gavin A. Schmidt

(Gavin Schmidt is a climate modeller at the NASA Goddard Institute for Space Studies in New York and is interested in modeling past, present and future climate. He works on developing and improving coupled climate models and, in particular, is interested in how their results can be compared to paleoclimatic proxy data. He has worked on assessing the climate response to multiple forcings, including solar irradiance, atmospheric chemistry, aerosols, and greenhouse gases.

He received a BA (Hons) in Mathematics from Oxford University, a PhD in Applied Mathematics from University College London and was a NOAA Postdoctoral Fellow in Climate and Global Change Research. He is a co-chair of the CLIVAR/PAGES Intersection Panel and is an Associate Editor for the Journal of Climate. He was cited by Scientific American as one of the 50 Research Leaders of 2004, and has worked on Education and Outreach with the American Museum of Natural History, the College de France and the New York Academy of Sciences. He has over 90 peer-reviewed publications and is the co-author with Josh Wolfe of “Climate Change: Picturing the Science” (W. W. Norton, 2009), a collaboration between climate scientists and photographers. He was awarded the inaugural AGU Climate Communications Prize in 2011.


More information about his research and publication record can be found here.)


This is the same kind of scientific intimidation that begot the phrase "the oceans are 30% more acidic".. Which is kinda true if you accept the fact that THIS logarithmic relationship of PH yields the observation that FRESH glacial WATER is 960 PERCENT the acidicity of ocean water. Not a very USEABLE scientific fact is it?

Same kind of bullying here about the natural log forcing function of CO2 I highlighted above. Anyone that recognizes the LN forcing function plot of CO2 ---

flacaltenn-albums-charts-picture3908-co2force.png


-- will IMMEDIATELY see that continued doubling produces LESS of an effect compared to the magnitude increase of the Concentration ratios.. Schmidt can only make the claim that

Logarithmic means that the effects of doubling are constant
because you are ADDING the same increase for each doubling. Let's make a chart..

C/Co ln(C/Co)

1 0
2 .69
4 1.39
8 2.08
16 2.77
32 3.46

Note that for each DOUBLING of the concentration -- the ln(C/Co) adds 0.69. Thus Schmidt is using shaman tactics to make an assertion that while NOT A LIE -- is EXTREMELY devious as it applies to the discussion. You add the same amount of effect, but to GET the same effect -- you are adding PROGRESSIVELY MUCH LARGER AMOUNTS of CO2. And given that the relative concentration of CO2 is beyond it's 8th or 9th doubling, the amount of warming that is being produced by the LATEST doubling took TREMENDOUS increases in the amount of CO2 to achieve.

You can take his credentials and shove them up your glory hole TinkerBelle -- I wouldn't trust this man with undergrads or any other gullible lay persons.. He is nothing but a charlatan using his skills to demean and intimidate others....

THIS - is the kind of "science" that you are condoning.. Schoolyard -- in your face -- manipulative cheating in order to destroy dissent.. And if you don't get it --- you shouldn't be in the discussion... If that's what you adore and think is sooo clever and cute -- you're gonna go down in flames with "your heroes".....
 
Last edited:
LOLOLOLOLOL....oh come on, you silly retard....I said the charts showed the same thing and they do....and I asked you what your point is but I guess your only point is the one on your head.

The charts do NOT show the "same thing," you tragically pathetic idiot.

OK Mr, Retardo, here's the charts we posted. Looking at the CO2 and the H2O lines, tell us what you imagine the difference to be.

image7.gif

spectra.png

The difference is DundrHead -- that your OWN QUOTE a few posts up (which you either did not read or comprehend) TOLD YOU that the important part of the charts was at about 10 um. Because that's the peak of reflected long wave from the surface. Well your chart from the 1950s cut off soon below 10um and missed the point of the GREATEST impact of the Water/CO2 overlap in that region.. That's why I posted yet another version that MARKED OUT THE band over which the blackbody radiation back from the surface was dominant.
 
Good way to conclusively demonstrate that you're another brainwashed and totally clueless denier cultist - link to a bogus denier cult blog run by some unknown non-scientist and loaded with with half-assed pseudo-science. You're soooooo gullible. Here's a response from a real climate scientist.

What is RealClimate’s take on T. J. Nelson’s “Cold Facts on Global Warming”

Response: Nelson appears to base his entire argument on the 'fact' that CO2 contributes 4 to 8% of the total greenhouse effect (of 33 deg C), and therefore a doubling of CO2 can only increase the total greenhouse effect proportionatly. Apart from being wrong about the effect of CO2 (around 9 to 25% of the longwave absorbtion depending on how you calculate the overlaps (see our previous post), this is way too linear a calculation to be applicable. In particular, he assumes that water vapour amounts are independent of the temperature (they are not). There are a number of other obvious bloopers (ie. "In fact, the effect of carbon dioxide is roughly logarithmic. Each time carbon dioxide (or some other greenhouse gas) is doubled, the increase in temperature is less than the previous increase". No. Logarithmic means that the effects of doubling are constant). So in toto, it's not too impressive a thesis. See our posts on climate sensitivity (or here) for more considered information. - Dr. Gavin A. Schmidt

(Gavin Schmidt is a climate modeller at the NASA Goddard Institute for Space Studies in New York and is interested in modeling past, present and future climate. He works on developing and improving coupled climate models and, in particular, is interested in how their results can be compared to paleoclimatic proxy data. He has worked on assessing the climate response to multiple forcings, including solar irradiance, atmospheric chemistry, aerosols, and greenhouse gases.

He received a BA (Hons) in Mathematics from Oxford University, a PhD in Applied Mathematics from University College London and was a NOAA Postdoctoral Fellow in Climate and Global Change Research. He is a co-chair of the CLIVAR/PAGES Intersection Panel and is an Associate Editor for the Journal of Climate. He was cited by Scientific American as one of the 50 Research Leaders of 2004, and has worked on Education and Outreach with the American Museum of Natural History, the College de France and the New York Academy of Sciences. He has over 90 peer-reviewed publications and is the co-author with Josh Wolfe of “Climate Change: Picturing the Science” (W. W. Norton, 2009), a collaboration between climate scientists and photographers. He was awarded the inaugural AGU Climate Communications Prize in 2011.


More information about his research and publication record can be found here.)


This is the same kind of scientific intimidation that begot the phrase "the oceans are 30% more acidic".. Which is kinda true if you accept the fact that THIS logarithmic relationship of PH yields the observation that FRESH glacial WATER is 960 PERCENT the acidicity of ocean water. Not a very USEABLE scientific fact is it?

Same kind of bullying here about the natural log forcing function of CO2 I highlighted above. Anyone that recognizes the LN forcing function plot of CO2 ---

flacaltenn-albums-charts-picture3908-co2force.png


-- will IMMEDIATELY see that continued doubling produces LESS of an effect compared to the magnitude increase of the Concentration ratios.. Schmidt can only make the claim that

Logarithmic means that the effects of doubling are constant
because you are ADDING the same increase for each doubling. Let's make a chart..

C/Co ln(C/Co)

1 0
2 .69
4 1.39
8 2.08
16 2.77
32 3.46

Note that for each DOUBLING of the concentration -- the ln(C/Co) adds 0.69. Thus Schmidt is using shaman tactics to make an assertion that while NOT A LIE -- is EXTREMELY devious as it applies to the discussion. You add the same amount of effect, but to GET the same effect -- you are adding PROGRESSIVELY MUCH LARGER AMOUNTS of CO2. And given that the relative concentration of CO2 is beyond it's 8th or 9th doubling, the amount of warming that is being produced by the LATEST doubling took TREMENDOUS increases in the amount of CO2 to achieve.

You can take his credentials and shove them up your glory hole TinkerBelle -- I wouldn't trust this man with undergrads or any other gullible lay persons.. He is nothing but a charlatan using his skills to demean and intimidate others....

THIS - is the kind of "science" that you are condoning.. Schoolyard -- in your face -- manipulative cheating in order to destroy dissent.. And if you don't get it --- you shouldn't be in the discussion... If that's what you adore and think is sooo clever and cute -- you're gonna go down in flames with "your heroes".....

You just demonstrate once again that you don't understand the anything about this.

If I have to choose between an analysis by a world class scientist with almost a hundred peer reviewed publications in this field to his name and the analysis of an anonymous retard on a public debate forum, a retard who has repeatedly demonstrated that he is a brainwashed ignorant idiot who is completely clueless on this topic, I know which analysis I will take seriously.
 
The charts do NOT show the "same thing," you tragically pathetic idiot.

OK Mr, Retardo, here's the charts we posted. Looking at the CO2 and the H2O lines, tell us what you imagine the difference to be.

image7.gif

spectra.png

The difference is DundrHead -- that your OWN QUOTE a few posts up (which you either did not read or comprehend) TOLD YOU that the important part of the charts was at about 10 um. Because that's the peak of reflected long wave from the surface. Well your chart from the 1950s cut off soon below 10um and missed the point of the GREATEST impact of the Water/CO2 overlap in that region.. That's why I posted yet another version that MARKED OUT THE band over which the blackbody radiation back from the surface was dominant.
What on Earth are you blathering about, dumbass? Both charts show that from about 10 to 20 um the water vapor absorption is weak and partial and the CO2 absorption is total.
 
Good way to conclusively demonstrate that you're another brainwashed and totally clueless denier cultist - link to a bogus denier cult blog run by some unknown non-scientist and loaded with with half-assed pseudo-science. You're soooooo gullible. Here's a response from a real climate scientist.

What is RealClimate’s take on T. J. Nelson’s “Cold Facts on Global Warming”

Response: Nelson appears to base his entire argument on the 'fact' that CO2 contributes 4 to 8% of the total greenhouse effect (of 33 deg C), and therefore a doubling of CO2 can only increase the total greenhouse effect proportionatly. Apart from being wrong about the effect of CO2 (around 9 to 25% of the longwave absorbtion depending on how you calculate the overlaps (see our previous post), this is way too linear a calculation to be applicable. In particular, he assumes that water vapour amounts are independent of the temperature (they are not). There are a number of other obvious bloopers (ie. "In fact, the effect of carbon dioxide is roughly logarithmic. Each time carbon dioxide (or some other greenhouse gas) is doubled, the increase in temperature is less than the previous increase". No. Logarithmic means that the effects of doubling are constant). So in toto, it's not too impressive a thesis. See our posts on climate sensitivity (or here) for more considered information. - Dr. Gavin A. Schmidt

(Gavin Schmidt is a climate modeller at the NASA Goddard Institute for Space Studies in New York and is interested in modeling past, present and future climate. He works on developing and improving coupled climate models and, in particular, is interested in how their results can be compared to paleoclimatic proxy data. He has worked on assessing the climate response to multiple forcings, including solar irradiance, atmospheric chemistry, aerosols, and greenhouse gases.

He received a BA (Hons) in Mathematics from Oxford University, a PhD in Applied Mathematics from University College London and was a NOAA Postdoctoral Fellow in Climate and Global Change Research. He is a co-chair of the CLIVAR/PAGES Intersection Panel and is an Associate Editor for the Journal of Climate. He was cited by Scientific American as one of the 50 Research Leaders of 2004, and has worked on Education and Outreach with the American Museum of Natural History, the College de France and the New York Academy of Sciences. He has over 90 peer-reviewed publications and is the co-author with Josh Wolfe of “Climate Change: Picturing the Science” (W. W. Norton, 2009), a collaboration between climate scientists and photographers. He was awarded the inaugural AGU Climate Communications Prize in 2011.


More information about his research and publication record can be found here.)


This is the same kind of scientific intimidation that begot the phrase "the oceans are 30% more acidic".. Which is kinda true if you accept the fact that THIS logarithmic relationship of PH yields the observation that FRESH glacial WATER is 960 PERCENT the acidicity of ocean water. Not a very USEABLE scientific fact is it?

Same kind of bullying here about the natural log forcing function of CO2 I highlighted above. Anyone that recognizes the LN forcing function plot of CO2 ---

flacaltenn-albums-charts-picture3908-co2force.png


-- will IMMEDIATELY see that continued doubling produces LESS of an effect compared to the magnitude increase of the Concentration ratios.. Schmidt can only make the claim that

Logarithmic means that the effects of doubling are constant
because you are ADDING the same increase for each doubling. Let's make a chart..

C/Co ln(C/Co)

1 0
2 .69
4 1.39
8 2.08
16 2.77
32 3.46

Note that for each DOUBLING of the concentration -- the ln(C/Co) adds 0.69. Thus Schmidt is using shaman tactics to make an assertion that while NOT A LIE -- is EXTREMELY devious as it applies to the discussion. You add the same amount of effect, but to GET the same effect -- you are adding PROGRESSIVELY MUCH LARGER AMOUNTS of CO2. And given that the relative concentration of CO2 is beyond it's 8th or 9th doubling, the amount of warming that is being produced by the LATEST doubling took TREMENDOUS increases in the amount of CO2 to achieve.

You can take his credentials and shove them up your glory hole TinkerBelle -- I wouldn't trust this man with undergrads or any other gullible lay persons.. He is nothing but a charlatan using his skills to demean and intimidate others....

THIS - is the kind of "science" that you are condoning.. Schoolyard -- in your face -- manipulative cheating in order to destroy dissent.. And if you don't get it --- you shouldn't be in the discussion... If that's what you adore and think is sooo clever and cute -- you're gonna go down in flames with "your heroes".....

You just demonstrate once again that you don't understand the anything about this.

If I have to choose between an analysis by a world class scientist with almost a hundred peer reviewed publications in this field to his name and the analysis of an anonymous retard on a public debate forum, a retard who has repeatedly demonstrated that he is a brainwashed ignorant idiot who is completely clueless on this topic, I know which analysis I will take seriously.

And there it is my fellow USMB'ers.. The pitiful state of technology education in this country.. Not even really Calculus level curriculum required to understand my post. I'm supposing Algebra II -- yet the Princess has CHOSEN her knight. For thoust are the same bullying cheaters, I wish thee both great happiness my lady..

I cannot spend time making up for your poor comprehension of basic mathematics when you choose to lash out like that..
 
Last edited:
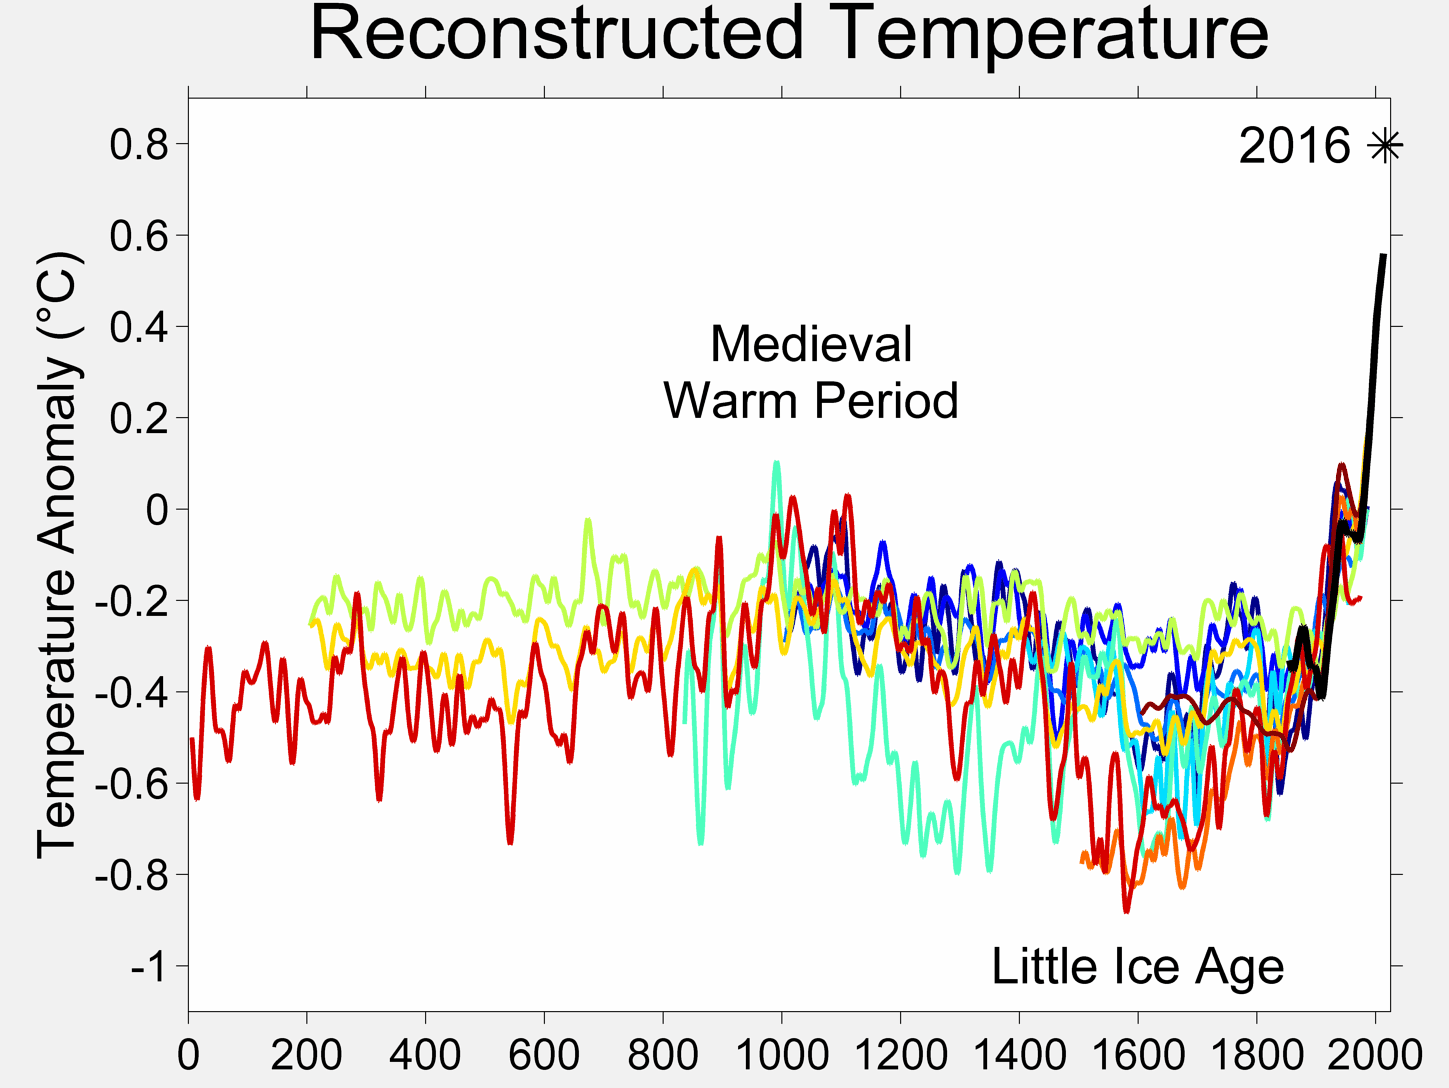
tempature anomaly for the last 2000 years. See that little spike at the end? Keep denying that and we will all be dead. For you 'end of the worlders' I guess that does not matter but for me it does.
2000_Year_Temperature_Comparison.png
 
Nobody's denying that "little spike". ANYONE??? See -- no one.. And FEW of us are bellowing about the "end times" that it portends. Except for alarmists like you..

What's being denied is the certainty that CO2 ALONE and primarily has caused that spike. Given that the world survived with an abundance of plant and animal species present in CO2 concentrations up to 10 TIMES what it is today -- we ought to be asking bigger questions about climate cycles and NATURAL forcings that explain more of climate history than CO2 does alone. It's a theory of political convienience that has been elevated to "proven" status purely by force of will..

So are you trying to get regulators off your back about emitting CO2?

No Actually -- I'm trying first and foremost to salvage any integrity science has left after clowns like you inject your silly political frameworks smack dab in the middle of the process.

But I do find it Orwellian that your govt claims that CO2 is a pollutant considering the concentrations of that pollutant are higher in your lungs than in the air you breathe.

I'm tired of doing this mambo for every new partisian hack that shows up.. I want to discuss the details of the "theory" and actually learn what the real climate drivers are and have been for millenia --- And YOU?? What's your desire for confronting me about my beliefs?
 
OK Mr, Retardo, here's the charts we posted. Looking at the CO2 and the H2O lines, tell us what you imagine the difference to be.

image7.gif

spectra.png

The difference is DundrHead -- that your OWN QUOTE a few posts up (which you either did not read or comprehend) TOLD YOU that the important part of the charts was at about 10 um. Because that's the peak of reflected long wave from the surface. Well your chart from the 1950s cut off soon below 10um and missed the point of the GREATEST impact of the Water/CO2 overlap in that region.. That's why I posted yet another version that MARKED OUT THE band over which the blackbody radiation back from the surface was dominant.
What on Earth are you blathering about, dumbass? Both charts show that from about 10 to 20 um the water vapor absorption is weak and partial and the CO2 absorption is total.

You really don't want to be left with ANY cred do ya? Your plots didn't even GO to 20um DundrHead. DO YOU SEE THAT? The little axis marky thingies are there -- BUT THERE'S NO DATA in your plot !!!! And when you look at that important area, the local CO2 absorption spike is on the rising edge of TOTAL ABSORPTION by water vapor for longer waves. There IS an overlap...

Not only do you lack the Algebra II chops of a 15 yr old --- I'm thinking you slept thru Algebra I and graph reading as well..
 
Nobody's denying that "little spike". ANYONE??? See -- no one.. And FEW of us are bellowing about the "end times" that it portends. Except for alarmists like you..

What's being denied is the certainty that CO2 ALONE and primarily has caused that spike. Given that the world survived with an abundance of plant and animal species present in CO2 concentrations up to 10 TIMES what it is today -- we ought to be asking bigger questions about climate cycles and NATURAL forcings that explain more of climate history than CO2 does alone. It's a theory of political convienience that has been elevated to "proven" status purely by force of will..

So are you trying to get regulators off your back about emitting CO2?

No Actually -- I'm trying first and foremost to salvage any integrity science has left after clowns like you inject your silly political frameworks smack dab in the middle of the process.

But I do find it Orwellian that your govt claims that CO2 is a pollutant considering the concentrations of that pollutant are higher in your lungs than in the air you breathe.

I'm tired of doing this mambo for every new partisian hack that shows up.. I want to discuss the details of the "theory" and actually learn what the real climate drivers are and have been for millenia --- And YOU?? What's your desire for confronting me about my beliefs?

It is late so I will check this in the morning. But to understand you correctly you disagree with:
"Carbon dioxide (CO2) is the primary greenhouse gas emitted through human activities. In 2010, CO2 accounted for about 84% of all U.S. greenhouse gas emissions from human activities."
Carbon Dioxide Emissions | Climate Change | US EPA

Say good-night to Cleo with the solar fan for me.
 
Good way to conclusively demonstrate that you're another brainwashed and totally clueless denier cultist - link to a bogus denier cult blog run by some unknown non-scientist and loaded with with half-assed pseudo-science. You're soooooo gullible. Here's a response from a real climate scientist.

What is RealClimate’s take on T. J. Nelson’s “Cold Facts on Global Warming”

Response: Nelson appears to base his entire argument on the 'fact' that CO2 contributes 4 to 8% of the total greenhouse effect (of 33 deg C), and therefore a doubling of CO2 can only increase the total greenhouse effect proportionatly. Apart from being wrong about the effect of CO2 (around 9 to 25% of the longwave absorbtion depending on how you calculate the overlaps (see our previous post), this is way too linear a calculation to be applicable. In particular, he assumes that water vapour amounts are independent of the temperature (they are not). There are a number of other obvious bloopers (ie. "In fact, the effect of carbon dioxide is roughly logarithmic. Each time carbon dioxide (or some other greenhouse gas) is doubled, the increase in temperature is less than the previous increase". No. Logarithmic means that the effects of doubling are constant). So in toto, it's not too impressive a thesis. See our posts on climate sensitivity (or here) for more considered information. - Dr. Gavin A. Schmidt

(Gavin Schmidt is a climate modeller at the NASA Goddard Institute for Space Studies in New York and is interested in modeling past, present and future climate. He works on developing and improving coupled climate models and, in particular, is interested in how their results can be compared to paleoclimatic proxy data. He has worked on assessing the climate response to multiple forcings, including solar irradiance, atmospheric chemistry, aerosols, and greenhouse gases.

He received a BA (Hons) in Mathematics from Oxford University, a PhD in Applied Mathematics from University College London and was a NOAA Postdoctoral Fellow in Climate and Global Change Research. He is a co-chair of the CLIVAR/PAGES Intersection Panel and is an Associate Editor for the Journal of Climate. He was cited by Scientific American as one of the 50 Research Leaders of 2004, and has worked on Education and Outreach with the American Museum of Natural History, the College de France and the New York Academy of Sciences. He has over 90 peer-reviewed publications and is the co-author with Josh Wolfe of “Climate Change: Picturing the Science” (W. W. Norton, 2009), a collaboration between climate scientists and photographers. He was awarded the inaugural AGU Climate Communications Prize in 2011.


More information about his research and publication record can be found here.)


This is the same kind of scientific intimidation that begot the phrase "the oceans are 30% more acidic".. Which is kinda true if you accept the fact that THIS logarithmic relationship of PH yields the observation that FRESH glacial WATER is 960 PERCENT the acidicity of ocean water. Not a very USEABLE scientific fact is it?

Same kind of bullying here about the natural log forcing function of CO2 I highlighted above. Anyone that recognizes the LN forcing function plot of CO2 ---

flacaltenn-albums-charts-picture3908-co2force.png


-- will IMMEDIATELY see that continued doubling produces LESS of an effect compared to the magnitude increase of the Concentration ratios.. Schmidt can only make the claim that

Logarithmic means that the effects of doubling are constant
because you are ADDING the same increase for each doubling. Let's make a chart..

C/Co ln(C/Co)

1 0
2 .69
4 1.39
8 2.08
16 2.77
32 3.46

Note that for each DOUBLING of the concentration -- the ln(C/Co) adds 0.69. Thus Schmidt is using shaman tactics to make an assertion that while NOT A LIE -- is EXTREMELY devious as it applies to the discussion. You add the same amount of effect, but to GET the same effect -- you are adding PROGRESSIVELY MUCH LARGER AMOUNTS of CO2. And given that the relative concentration of CO2 is beyond it's 8th or 9th doubling, the amount of warming that is being produced by the LATEST doubling took TREMENDOUS increases in the amount of CO2 to achieve.

You can take his credentials and shove them up your glory hole TinkerBelle -- I wouldn't trust this man with undergrads or any other gullible lay persons.. He is nothing but a charlatan using his skills to demean and intimidate others....

THIS - is the kind of "science" that you are condoning.. Schoolyard -- in your face -- manipulative cheating in order to destroy dissent.. And if you don't get it --- you shouldn't be in the discussion... If that's what you adore and think is sooo clever and cute -- you're gonna go down in flames with "your heroes".....

You just demonstrate once again that you don't understand the anything about this.

If I have to choose between an analysis by a world class scientist with almost a hundred peer reviewed publications in this field to his name and the analysis of an anonymous retard on a public debate forum, a retard who has repeatedly demonstrated that he is a brainwashed ignorant idiot who is completely clueless on this topic, I know which analysis I will take seriously.

Wow. You were better off shutting the fuck up. Clearly you don't know dick about anything and instead of answering the science in the post you trot out the "world class scientist" Epic Fail
 
tempature anomaly for the last 2000 years. See that little spike at the end? Keep denying that and we will all be dead. For you 'end of the worlders' I guess that does not matter but for me it does.
2000_Year_Temperature_Comparison.png


See that little spike at the end? Yes, that one...it doesn't exist. It only exists in the fevered imagination of one Michael Mann, as poor an excuse for a scientist as can be found on this planet.
 
So are you trying to get regulators off your back about emitting CO2?

No Actually -- I'm trying first and foremost to salvage any integrity science has left after clowns like you inject your silly political frameworks smack dab in the middle of the process.

But I do find it Orwellian that your govt claims that CO2 is a pollutant considering the concentrations of that pollutant are higher in your lungs than in the air you breathe.

I'm tired of doing this mambo for every new partisian hack that shows up.. I want to discuss the details of the "theory" and actually learn what the real climate drivers are and have been for millenia --- And YOU?? What's your desire for confronting me about my beliefs?

It is late so I will check this in the morning. But to understand you correctly you disagree with:
"Carbon dioxide (CO2) is the primary greenhouse gas emitted through human activities. In 2010, CO2 accounted for about 84% of all U.S. greenhouse gas emissions from human activities."
Carbon Dioxide Emissions | Climate Change | US EPA

Say good-night to Cleo with the solar fan for me.


Correct. CO2 is a miniscule GHG compared to water vapor which is THE dominant GHG.
 
No Actually -- I'm trying first and foremost to salvage any integrity science has left after clowns like you inject your silly political frameworks smack dab in the middle of the process.

But I do find it Orwellian that your govt claims that CO2 is a pollutant considering the concentrations of that pollutant are higher in your lungs than in the air you breathe.

I'm tired of doing this mambo for every new partisian hack that shows up.. I want to discuss the details of the "theory" and actually learn what the real climate drivers are and have been for millenia --- And YOU?? What's your desire for confronting me about my beliefs?

It is late so I will check this in the morning. But to understand you correctly you disagree with:
"Carbon dioxide (CO2) is the primary greenhouse gas emitted through human activities. In 2010, CO2 accounted for about 84% of all U.S. greenhouse gas emissions from human activities."
Carbon Dioxide Emissions | Climate Change | US EPA

Say good-night to Cleo with the solar fan for me.
Correct. CO2 is a miniscule GHG compared to water vapor which is THE dominant GHG.

In the real world, CO2 accounts for about 20% of global warming, which is only "miniscule" when seen through crazy denier cult eyes. Of course, the really important point is that CO2 is a 'forcing' that doesn't just raise temperatures on its own but also causes 'feedbacks', of which water vapor is one, such that the temperature increase created by the increased CO2 levels causes more water to evaporate thus raising the water vapor levels in the atmosphere which increases the greenhouse effect, further raising the temperatures.

Climate myths: CO2 isn't the most important greenhouse gas
New Scientist
by David L Chandler
(excerpts)

Water is a major greenhouse gas too, but its level in the atmosphere depends on temperature. Excess water vapour rains out in days. Excess CO2 accumulates, warming the atmosphere, which raises water vapour levels and causes further warming. Firstly, there is the greenhouse effect, and then there is global warming. The greenhouse effect is caused by certain gases (and clouds) absorbing and re-emitting the infrared radiating from Earth's surface. It currently keeps our planet 20°C to 30°C warmer than it would be otherwise. Global warming is the rise in temperatures caused by an increase in the levels of greenhouse gases due to human activity.

Water vapour is by far the most important contributor to the greenhouse effect. Pinning down its precise contribution is tricky, not least because the absorption spectra of different greenhouse gases overlap. At some of these overlaps, the atmosphere already absorbs 100% of radiation, meaning that adding more greenhouse gases cannot increase absorption at these specific frequencies. For other frequencies, only a small proportion is currently absorbed, so higher levels of greenhouse gases do make a difference. This means that when it comes to the greenhouse effect, two plus two does not equal four. If it were possible to leave the clouds but remove all other water vapour from the atmosphere, only about 40% less infrared of all frequencies would be absorbed. Take away the clouds and all other greenhouses gases, however, and the water vapour alone would still absorb about 60% of the infrared now absorbed.

By contrast, if CO2 alone was removed from the atmosphere, only 15% less infrared would be absorbed. If CO2 was the only greenhouse gas, it would absorb 26% of the infrared currently absorbed by the atmosphere. A simplified summary is that about 50% of the greenhouse effect is due to water vapour, 25% due to clouds, 20% to CO2, with other gases accounting for the remainder. But the overall quantities of these other gases are tiny. Even allowing for the relative strength of the effects, CO2 is still responsible for two-thirds of the additional warming caused by all the greenhouse gases emitted as a result of human activity. Water vapour will play a huge role in the centuries to come, though. Climate models, backed by satellite measurements, suggest that the amount of water vapour in the upper troposphere (about 5 to 10 kilometres up) will double by the end of this century as temperatures rise. This will result in roughly twice as much warming than if water vapour remained constant. Changes in clouds could lead to even greater amplification of the warming or reduce it - there is great uncertainty about this. What is certain is that, in the jargon of climate science, water vapour is a feedback, but not a forcing.
 
Last edited:
Is this a made up graph also?
5_Atmospheric_GHG_1.jpg

Probably not.. But ask yourself -- WHY did they stop at the oldest date that they chose?

You DO REALIZE that the earth was in a series of Ice Ages during that graph and climate was ANYTHING but the "consistent normal" that humans grew up in and enjoy.. Hard to replicate current conditions when 1/2 the world is covered in ICE isn't it?

Better to go look on a LONGER timescale and see what you find.. I'm not doing the heavy lifting anymore because most folks don't want to learn -- they just want a beat-down. But I'll wager there were lush tropical forests and dinosaurs running around with TEN TIMES the CO2 that we currently have in the atmosphere...

Draw your OWN conclusions why EPA.GOV would trot out a badly representative chart like that to make the Circus SideShow look more impressive.. And speculate on your own as to why with 10 times the CO2 -- the oceans didn't just boil off and killer hurricanes didn't run all the way to the Arctic Circle..
 
Last edited:

Forum List

Back
Top