Old Rocks
Diamond Member
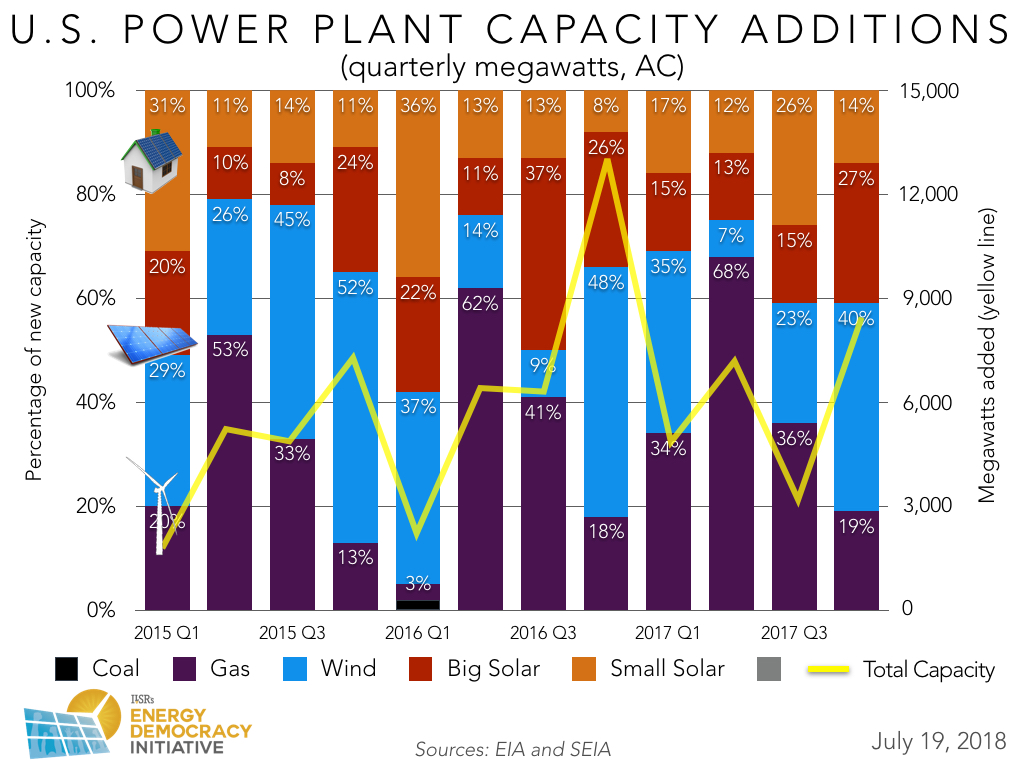
Yes, coal is dying.
Follow along with the video below to see how to install our site as a web app on your home screen.

Note: This feature currently requires accessing the site using the built-in Safari browser.
Yes, coal is dying.


Yes, coal is dying.
Old fraud has no cognitive skills. Adding more amperage causes massive voltage spikes making the grid very unstable.What's happening in that chart is that REDUNDANT SUPPLEMENTS are being added to the EXISTING Grid Capacity so that "occasionally" these wind/solar supplements PREEMPT the use of primary generators IF they are stable and reliable for that period of use.. It's not INCREASED capacity of any kind.
Old fraud has no cognitive skills. Adding more amperage causes massive voltage spikes making the grid very unstable.What's happening in that chart is that REDUNDANT SUPPLEMENTS are being added to the EXISTING Grid Capacity so that "occasionally" these wind/solar supplements PREEMPT the use of primary generators IF they are stable and reliable for that period of use.. It's not INCREASED capacity of any kind.
The Laramie range is a wind zone 5-6. It has wind for about 18 hours a day due to the up slope to the Continental divide and there is almost always a high pressure and low pressure on one side or the other.Wind OTH -- isn't even marketable. You can not schedule it or market it or sell it on the daily/monthly wholesale markets. It takes WEEKS OFF at a time. And DOES create the possibility for "blowing up the grid" with "amperage" spikes. It really has no business "on-grid".
The real question is, do you remember how to use it?I tire of people like you, true believers who use personal attacks ("pseudo educated dupe", for example) and bandy about statistics as if they (you) are an authority.
My BA degrees were in History and Poli Sci, my Master's in the Dept of Education, a special studies program: Human Relations (course work in Psyc. Sociology, Social Psyc. Anthropology, Counseling and IR). And, my education during my 32 year career in Law Enforcement.
Of course I had Math and Science lower division courses (Chem, Physics and Biology). My opinion is based on secondary sources, such as those listed in this link to a number of studies:
Google Scholar
Hm. Not one of your degrees is in an exact science. All subjective all the time eh. No wonder you don't understand how MEASUREMENT works.
And you probably believe 2 + 2 always = 4
It all depends on which measurement scale is being used, cupcake.
Good for you. Be honest now, did you look it up?
I tire of people like you, true believers who use personal attacks ("pseudo educated dupe", for example) and bandy about statistics as if they (you) are an authority.
My BA degrees were in History and Poli Sci, my Master's in the Dept of Education, a special studies program: Human Relations (course work in Psyc. Sociology, Social Psyc. Anthropology, Counseling and IR). And, my education during my 32 year career in Law Enforcement.
Of course I had Math and Science lower division courses (Chem, Physics and Biology). My opinion is based on secondary sources, such as those listed in this link to a number of studies:
Google Scholar
Hm. Not one of your degrees is in an exact science. All subjective all the time eh. No wonder you don't understand how MEASUREMENT works.
And you probably believe 2 + 2 always = 4
What a stupid comment.
You have Been SHOWN numerous times now that Coal is expanding and that the climate we live in is still well within natural variations.
Per Decade warming rate very similar to past warming rates back to the 1800's.
No increase in Tornadoes counts despite the improvement in technology.
Decrease in Landfalling Hurricanes, NO increase in total cyclone energy.
INCREASE in snow and cold in the last 10 years.
Antarctica ice near highest level of instrumental record.
Small increase in precipitation.
on and on it goes in the very opposite of what the AGW conjecture would project to happen.
Yawn.
No, I'm old enough that I still have my K&E slide rule. How about you?

Yes, coal is dying.
You do understand that when NEW CAPACITY is not needed at all because Demand is down, that 92% of NOTHING is STILL nothing right?
You do understand that you don't INCREASE overall capacity and margins with either wind or solar --- RIGHT?
I'm hoping that you do by now. You can't INCREASE overall Grid Capacity or margins with JUST sketchy wind and solar, because literally their ENTIRE CONTRIBUTION has to be backed by an EVER-READY RELIABLE generation source of some other kind.
So you're graph title is really a lie. What's happening in that chart is that REDUNDANT SUPPLEMENTS are being added to the EXISTING Grid Capacity so that "occasionally" these wind/solar supplements PREEMPT the use of primary generators IF they are stable and reliable for that period of use.. It's not INCREASED capacity of any kind.

Yes, coal is dying.
The real question is, do you remember how to use it?Hm. Not one of your degrees is in an exact science. All subjective all the time eh. No wonder you don't understand how MEASUREMENT works.
And you probably believe 2 + 2 always = 4
It all depends on which measurement scale is being used, cupcake.
Good for you. Be honest now, did you look it up?
Hm. Not one of your degrees is in an exact science. All subjective all the time eh. No wonder you don't understand how MEASUREMENT works.
And you probably believe 2 + 2 always = 4
What a stupid comment.
You have Been SHOWN numerous times now that Coal is expanding and that the climate we live in is still well within natural variations.
Per Decade warming rate very similar to past warming rates back to the 1800's.
No increase in Tornadoes counts despite the improvement in technology.
Decrease in Landfalling Hurricanes, NO increase in total cyclone energy.
INCREASE in snow and cold in the last 10 years.
Antarctica ice near highest level of instrumental record.
Small increase in precipitation.
on and on it goes in the very opposite of what the AGW conjecture would project to happen.
Yawn.
No, I'm old enough that I still have my K&E slide rule. How about you?
100 jobs created for coal. Thousands let go at Harley, Boeing and Carrier...way to go Orange Marmalade! Hey I hear Omaha Wagon Wheel Co is hiring die to their comeback in their booming industry!
100 jobs created for coal. Thousands let go at Harley, Boeing and Carrier...way to go Orange Marmalade! Hey I hear Omaha Wagon Wheel Co is hiring die to their comeback in their booming industry!
Let's add 30,000 more regulations, that'll help manufacturing!!!


It reminds you of these guys, doesn't it?:100 jobs created for coal. Thousands let go at Harley, Boeing and Carrier...way to go Orange Marmalade! Hey I hear Omaha Wagon Wheel Co is hiring die to their comeback in their booming industry!
Let's add 30,000 more regulations, that'll help manufacturing!!!
Holy Fuck....Todd....check the guys avatar!!!
Tells you all you need to know.... another guy who really does think coal is dying.
I love this forum!


That is the problem with statistics, change the qualifier for counting or the base line and you can make it say anything you want. Wyoming production jumped 40% in the last year.. it doesn't appear to reflect reality to me.WUWT?
June 17, 2018
TOTAL FAILURE of the climate crusade: Coal power has the same energy share it had 20 years ago
Excerpt:
"A couple of days ago, we noted that this year’s edition of BP’s annual Statistical Review of World Energy report on global energy use is out, and it contains one of the most telling charts about the failure of the climate crusade’s “war on coal” ever presented.
Most of the lamestream media coverage has focused on this particular chart from the BP report, which shows coal having a small uptick in 2017 after several years of decline. Doesn’t look like much, does it? Just a blip. Nothing for the enviro-faithful to worry about, the net trend is still down, right? They are blaming president Trump for it."

Beyond the Coal Boom: Powder River Basin Residents Look to a Diversified Future | The Bill Lane Center for the American West
Really? Care to post a link to that?
