RollingThunder
Gold Member
- Mar 22, 2010
- 4,818
- 522
- 155
Actually it was from a SINGLE tree in the entire grove. The rest of the grove showed nothing special.
Here's some discussions of the issue that debunk that brazen lie.
Yamal controversy - RationalWiki
Hey Ya! (mal)
Yes, that talks about actual science, hence the deniers here will all auto-scream it's a big fake.
The deniers here don't even try to discuss the science any more. No matter what the topic is, they just insta-scream that all the data is being faked by scary socialists. Every one of 'em is an ignorant cult troll, hellbent on their mission to shut down all rational discussion.
That's right, deniers. The whole planet is wrong, and only your tiny fringe political cult understands the RealTruth. I bet it makes you feel all tingly and important to believe that. You don't have to do anything except curse at your moral and intellectual betters, and you get proclaim how that makes you a superior human being. You get a huge emotional payoff for being lazy sociopaths. That kind of emotional lure must be irresistible to weak and immoral minds.
"tiny fringe political cult".....
Does anybody realize how University of Mars this statement is? This guy spends waaaaaaaaaaaaaaaaaaaaaaaaaay too much time in his apartment with the faggy cat!! You guys be the judge..............what the fuck is going on in that place people?
Pew poll from last year says only 28% of Americans think the scientists have this "consensus" thing right..read it right here >> Many Americans are skeptical about scientific research on climate and GM foods
So who really is the "tiny fringe political cult?
You and the other denier cult cretins are, for sure, kooksucker!
Well of course everybody knows that we always settle important scientific issues with public opinion polls and ignore the scientific research.....LOLOLOLOLOL.....you are so crazy, kooksucker.
And a liar too, of course.
In the real world....
Global Warming Concern at Three-Decade High in US
GALLUP
MARCH 14, 2017
WASHINGTON, D.C. -- Record percentages of Americans are concerned about global warming, believe it is occurring, consider it a serious threat and say it is caused by human activity. All of these perceptions are up significantly from 2015.
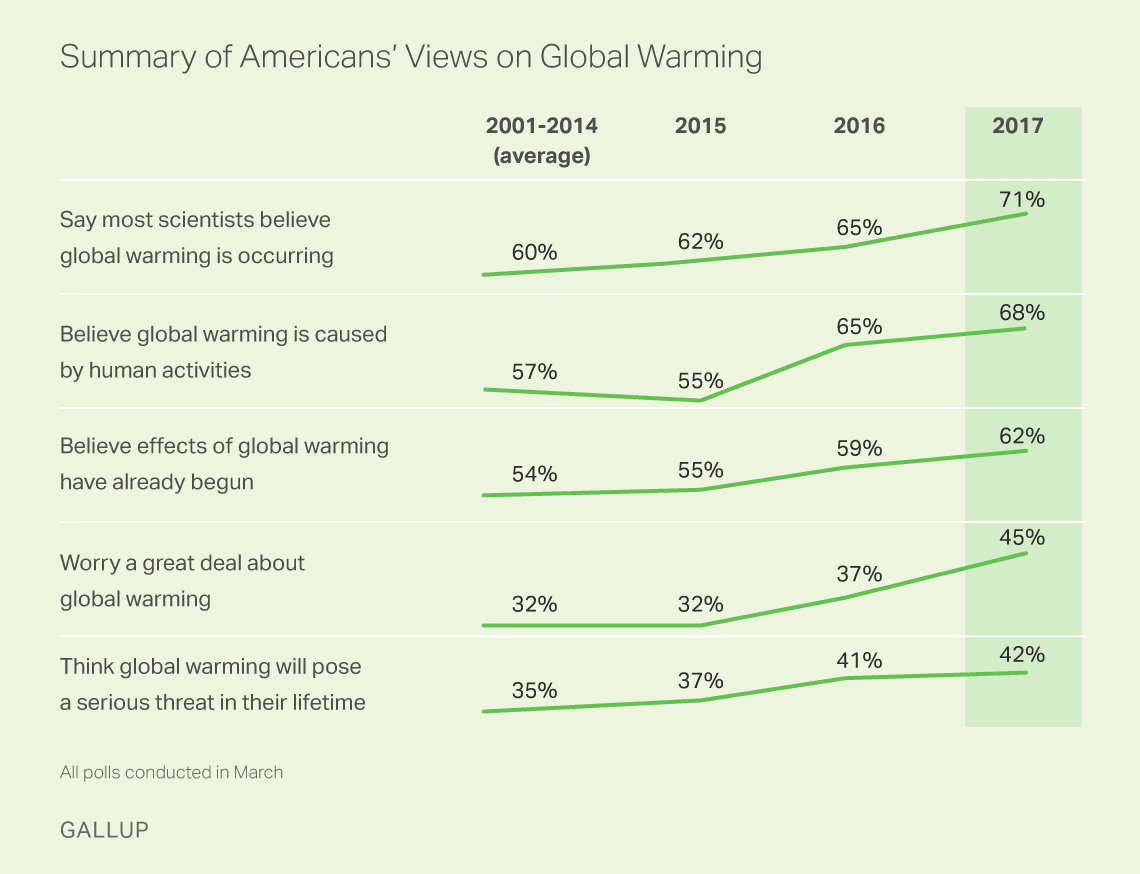
Forty-five percent of Americans now say they worry "a great deal" about global warming, up from 37% a year ago and well above the recent low point of 25% in 2011. The previous high was 41%, recorded in 2007. Another 21% currently say they worry "a fair amount" about global warming, while 18% worry "only a little" and 16% worry "not at all."
What's funny is you trot these ridiculous polls out and after decades of relentless propaganda, and outright lying, the reality is the overwhelming majority of Americans simply don't believe a word you say, and they don't care about what you say because of it. Your polls are about as good as the ones that claimed the shrilary had a 97% chance of being our POTUS.
LOLOLOLOLOLOL.......in the real world......at least 66% of Americans are pretty worried about human caused global warming and only the delusional rightwingnut retards in the bottom 34% are so stupid, ignorant and brainwashed to be not worried.
Forty-five percent of Americans now say they worry "a great deal" about global warming, up from 37% a year ago and well above the recent low point of 25% in 2011. The previous high was 41%, recorded in 2007. Another 21% currently say they worry "a fair amount" about global warming, while 18% worry "only a little" and 16% worry "not at all."