ozzmdj
Senior Member
NOAA: Summer Temperature Below Average for U.S........NOAA - National Oceanic and Atmospheric Administration - NOAA: Summer Temperature Below Average for U.S. 
Follow along with the video below to see how to install our site as a web app on your home screen.

Note: This feature currently requires accessing the site using the built-in Safari browser.
NOAA: Summer Temperature Below Average for U.S........NOAA - National Oceanic and Atmospheric Administration - NOAA: Summer Temperature Below Average for U.S.
And?
yep sounds irrelevant, in the PNW we tied a record yesterday for the most 90 degree days in a year, and if today gets over 90 we'll set a new record for the year, anomalies

And maybe you are incapable of doing the slightest research on your own.
AOL Search
Daily Updated Time series of Arctic sea ice area and extent derived from SSMI data provided by NANSEN. — Arctic ROOS
Arctic sea ice has thinned by more than 40% in five years, Nasa satellites show | Environment | guardian.co.uk
And another in the continuing study of the Arctic Sea ice Extent. Highlighted in red below is an interesting tid bit. In 1905, Amundson navigated the Northwest Passage. This strikes me as interesting in that it was open in 1905.
It was open again briefly recently and may or may not have been open this year. Have we cooled since 1905? If the ice is melting...
Arctic Sea Ice News & Analysis
Sea routes in the Arctic
The Northwest Passage is not a single passage, but rather a number of possible routes through the channels of the Canadian Arctic Archipelago. Satellite images show that the shallow and narrow southern route, which Amundsen navigated in 1905, appeared to open briefly this August. This route was also open in 2007 and 2008. The deeper northern route, of great interest for potential commercial transport, was open in 2007 but is still blocked by ice this year.
On the other side of the Arctic, the Northern Sea Route is open along most of the route, except for a narrow band of ice between the islands of Severnaya Zemlya and the Siberian mainland. Ice tends to persist in this area because of winds that push ice into the constrained region. Even during the record low extent year of 2007, the area around Severnaya Zemlya remained clogged with ice.
Evidence based on satellite data should not be taken as proof of safe conditions for shipping—hazardous areas of ice may remain.
yep sounds irrelevant, in the PNW we tied a record yesterday for the most 90 degree days in a year, and if today gets over 90 we'll set a new record for the year, anomalies
(Shhhh. Anybody mentions that it qualifies as neither and the AGW crowd will be all up in arms.)When it's WAY fucking HOT, that's AGW!
When it starts getting damn fucking COLD, that too is AGW (since applying algorian nuance results in knowing all about "paradoxical effects").
And if the average global temperature stays the same for any extended period of time, that's UTTERLY unexpected (said with ALARM!) and thus qualifies as concrete proof of -- you guessed it -- AGW!
But surely, it must either get hotter or colder or the temperature must remain unchanged, and therefore we have compelling PROOF of AGW!
This is "good science" as well as flawless logic!
AGW: it can't be "disproved" so it MUST be "good!"
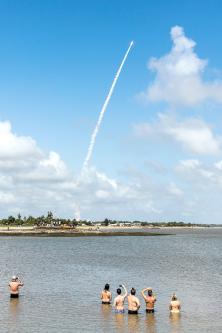
A detailed stream of images provided by the satellite is expected to sharpen weather forecasts, provide more advanced warning of floods and better tracking of wildfires, plumes and volcanic ash clouds. Carried atop an Atlas 5 rocket, the GOES-R satellite lifted off from Cape Canaveral Air Force Station at 6:42 p.m. EST. The launch was delayed an hour to resolve a technical issue with the rocket, developed by United Launch Alliance, a partnership of Lockheed Martin Corp. (LMT.N) and Boeing Co. (BA.N), said NASA launch commentator Mike Curie. A second, unrelated issue also contributed to the delay.
Once in position 22,300 miles (35,888 km) above the equator, GOES-R is designed to take a complete picture of the hemisphere every five minutes while simultaneously zooming in on specific regions to monitor fires, volcanic eruptions, heavy rainfall and storms. The satellite, the 17th in the Geostationary Operational Environmental Satellite (GOES) series, is the first to be launched since 2010. It is a step up from its predecessors, which take 30 minutes to image the hemisphere and are not capable of carrying out multiple tasks at the same time. “This is a quantum leap,” Sandra Cauffman, deputy director of Earth Sciences at NASA, said at a press conference on Thursday. "It will truly revolutionize weather forecasting.” The heart of the new satellite is a high-resolution camera, designed and built Exelis Inc., a subsidiary of Harris Corp (HRS.N). It can see in 16 wavelengths, compared with five available with the current system.
GOES-R, developed by NASA and the National Oceanic and Atmospheric Administration, has four times better resolution and can take images five times faster than its predecessors, said NOAA program scientist Steven Goodman. The satellite's capabilities go beyond weather forecasting. The sharper view will enable forecasters to see waves in clouds, for example, so pilots can avoid turbulence and give airline passengers smoother rides. GOES-R, built by Lockheed, includes the first operational lightning mapper, which will image lightning fields in the western hemisphere 200 times a second, NOAA said.
It is the first of four satellites in a system upgrade that will cost $11 billion, including launch fees, said NOAA Assistant Administrator Stephen Volz. The next satellite is slated for launch in 2018. GOES, along with a second, polar-orbiting weather satellite network operated by NOAA, has faced cost overruns and program delays due to technical issues and mismanagement, according to a December 2015 U.S. Government Accountability Office report. Once in orbit, the new satellite will undergo about 11 months of testing before it joins the operational fleet, which now numbers three units, NOAA said.
U.S. weather satellite's launch promises 'quantum leap' in forecasts
“Tackling the problem of space debris is one of humankind’s greatest environmental challenges, but is also perhaps the one that is the least known,” said Hugh Lewis, head of astronautics research at the University of Southampton. He was supporting the launch of a creative project at London’s Royal Astronomical Society by artists and scientists aiming to shed light on the 27,000 pieces of debris being tracked as they orbit the Earth. There are believed to be about 100 million pieces in total, but some are too small to chart. So-called “space junk” has been left in space during the many missions that have taken place since the Soviet Union launched Sputnik 1, the first artificial satellite, in 1957.
The debris now poses a serious threat to future space exploration, scientists say. “Every day we use and rely on services provided by satellites without ever realizing how vulnerable they are,” Lewis said. Space debris puts these satellites at risk of being destroyed or damaged and “may affect the dreams and ambitions of future generations to work and live in space,” he said. The project, titled Adrift, uses film, sound and social media to explore the dangers of space junk.
People watch a rocket with a payload of four satellites lift off from a European Space Agency facility in Kourou, French Guiana
A documentary by filmmaker Cath le Couteur features British-American meteorologist and astronaut Piers Sellers, who dropped his spatula during a space walk on NASA’s Discovery mission in 2006. The tool was left traveling at a speed of 27,000kph before burning up in the atmosphere. “Space debris as an operating astronaut, it was just the enemy... It’s a sleet of very fast-moving stuff,” Sellers said in the film. Speaking at the launch, Le Couteur said the documentary highlighted a “critical contemporary crisis.” “It is now a very serious threat to future space exploration, to us here on Earth, and to the damage and destruction of satellites that we rely on,” she said.
Audiences can “adopt” a piece of space junk on Twitter, such as Vanguard, the second US satellite into space and the oldest existing piece of space debris. The project also includes an attempt to follow audibly the path of space debris, using an electromechanical sound instrument to transform its movement into sound. BAFTA-winning composer and sound artist Nick Ryan recorded 1,000 sounds using objects chosen to represent space debris — which itself is silent — and used them to represent live data from space.
Space junk project exposes threat to missions - Taipei Times
