Still Hiding the Decline

IanC

Gold Member
Sep 22, 2009
11,061
1,344
245
Trakar asked me why the climate scientists would not use up to date proxy data if it was available. I don't really know the answer to that but I have strong suspicions that it is because they don't match up with the story that climate scientists want to tell.

An example to support my position-
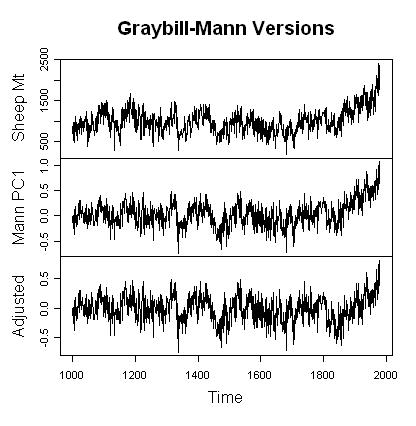
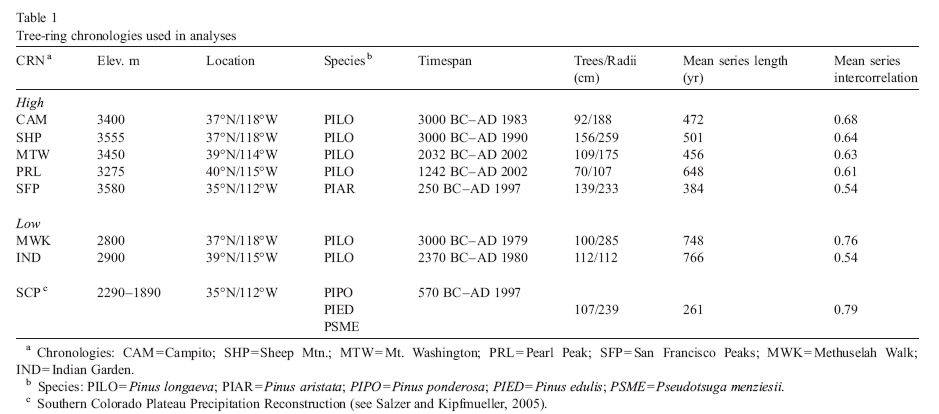
Salzer and Hughes (Hughes is the H in MBH98, the original Hockey Stick) 2006 uses treering data including Sheep Mtn.
hughes60.gif

which gives the hockey stick shape
hughes61.gif


Hughes' data set ends in 1990 (which is at least better than 1961) but is there newer, more up to date data? actually yes there is.
ababne32.gif


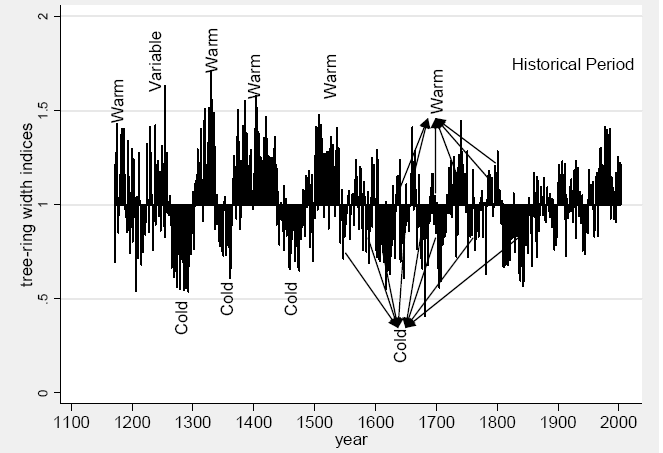
... we know that Linah Ababneh updated the Sheep Mountain data in 2002. We also know that Linah Ababneh’s update, aside from finding a difference between strip bark and whole bark chronologies, did not replicate Graybill’s results and had no HS shape whatever. (Figures for Sheep Mountain for strip bark and whole bark from 1600 on are shown separately in the thesis.) So the Sheep Mountain chronology had been updated – why wouldn’t this update have been used, aside from it not having a HS shape?

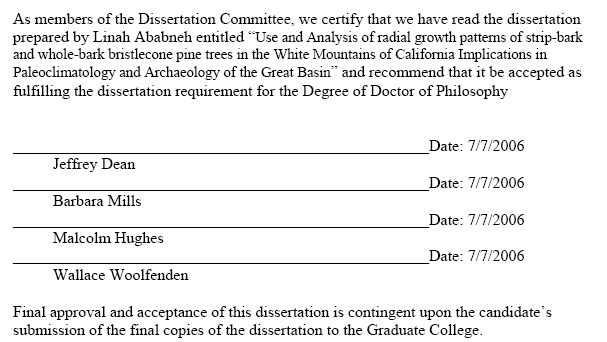
perhaps you are thinking that Hughes was somehow ignorant of this update, however unlikely that may be. the odds of that go from slim to non existent when you consider that Hughes was on the panel that gave Ababneh a PhD for a thesis based on this very update!
hughes59.gif


Trakar, you can deny all the sordid goings-on in climate science if you want to, no one can force you to open your eyes. but if you ever feel like exploring more of the details, the chronologies, the details, the arguments both pro and con (CA doesnt moderate comments like Real Climate) are all on ClimateClimate Audit Audit
 
Oh, and in true Hockey Team fashion, they are still hiding their data. especially when it is full of inconvenient information.
The Ababneh Data

I’ve tried to obtain the Ababneh data without success.

I emailed Linah Ababneh at what appears to be her present posting and got no response. I emailed David Meko of the University of Arizona, who has an excellent record of archiving chronologies and measurements, and inquired about a University of Arizona report by Stockton mentioned in the Ababneh thesis (that bender asked about) and about the Ababneh measurements. I reminded Meko that, in her thesis, she had undertaken to archive the measurements and presumably the university was responsible for ensuring that she completed the commitments in her thesis.

Meko wrote back saying that he had checked around the department and had been unable to locate the Stockton report. He also said that they did not have any of Ababneh’s measurement data and that they had lost track of her. He gave me the name of someone who might know where she was. He agreed that she should archive the data and suggested that I write to the funding agency who might take that into consideration in their grant process – (these are the people who put up with Lonnie Thompson and they’re supposed to take it out on Linah Ababneh? C’mon). He didn’t seem to think that the university had any responsibilities in the matter. He was quite pleasant, and , as I mentioned above, Meko himself has an excellent archiving record.

But what a typical climate science circus. Someone goes out and updates the critical Sheep Mountain data. It doesn’t show a Hockey Stick. Instead of using the updated version, Hughes uses the old version with a HS (doesn’t this sound like Jacoby and D’Arrigo at Gasp” where they withheld an update that didn’t have a HS and refused to give me the update when I learned that they were sitting on a non-HS update.) Now the person who got the data has moved and no one at Arizona has the data.

http://climateaudit.org/2007/11/01/hughes-and-the-ababneh-thesis/
 
Last edited:
My goodness, land sakes alive, looky here.
Image : New Temperature Reconstruction from Indo-Pacific Warm Pool : Woods Hole Oceanographic Institution

A lumpy Mann graph from the Woods Hole Institute. And a statement that the MWP was 0.5 C cooler than the end of 20th Century temps. Thank you, Walleyes
News Release : New Temperature Reconstruction from Indo-Pacific Warm Pool : Woods Hole Oceanographic Institution

Temperature reconstructions suggest that the Northern Hemisphere may have been slightly cooler (by about 0.5 degrees Celsius) during the 'Medieval Warm Period' (~AD 800-1300) than during the late-20th century. However, these temperature reconstructions are based on, in large part, data compiled from high latitude or high altitude terrestrial proxy records, such as tree rings and ice cores, from the Northern Hemisphere (NH). Little pre-historical temperature data from tropical regions like the IPWP has been incorporated into these analyses, and the global extent of warm temperatures during this interval is unclear. As a result, conclusions regarding past global temperatures still have some uncertainties.

So, we have a completely independent study from sources totally unrelated to the sources that Mann used, confirming the Hockey Stick Graph.

Care to explain that, dingleberry?

that graph has Mann's figures lower than everyone elses for the stick and higher than everyone elses for the blade. how is that confirmation of the Hockey Stick?
 

Forum List

Back
Top