fyi
Follow along with the video below to see how to install our site as a web app on your home screen.

Note: This feature currently requires accessing the site using the built-in Safari browser.

Good find. Telling how no one on the right has much to say about it.
I asked you first..
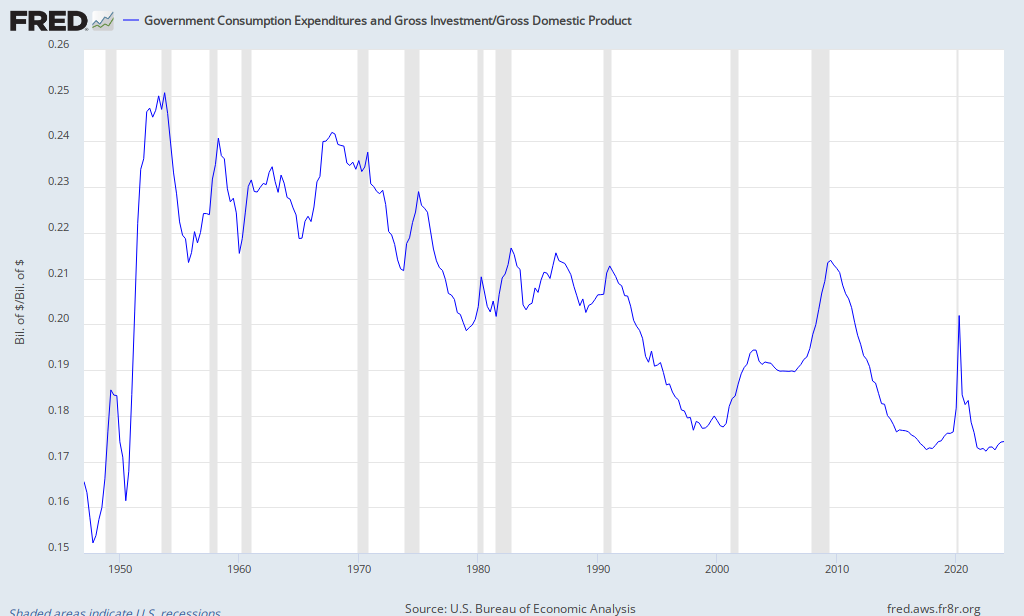
its telling us spending to gdp in % is lower than the historical average...what happy days? we are on a clear fiscally sound course, what? does this include spending built in btw?Is this in real dollars of fed revenue, outside deficit spending?
Taxes under Eisenhower were above 90% for the richest Americans. Thanks for pointing that out.
This economy is what happens when you throw money at rich people.


Expect it to get a lot worse:

This reminds me of how the Warmers point to some weather event on the planet and say "See that! Global Warming!!" Whats the point of the chart? See that! We can have Mo' n Bigga Deficits! So we need a deficit bigger than $1.6 Trillion? What $2 Trillion? $3 Trillion?
This reminds me of how the Warmers point to some weather event on the planet and say "See that! Global Warming!!" Whats the point of the chart? See that! We can have Mo' n Bigga Deficits! So we need a deficit bigger than $1.6 Trillion? What $2 Trillion? $3 Trillion?
Really? Really? That's what you get from this chart?
Gee, maybe I shouldn't scoff at rdean's 6% thing.
Your graph is bullshit.. spending as a % of GDP is the highist it's been since WWII
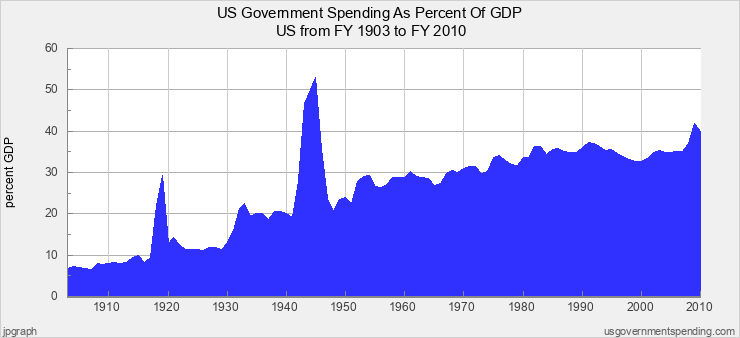
US Government Spending As Percent Of GDP in United States 1903-2010 - Federal State Local
 aside from the obvious?