Solar Activity Crashes

Weatherman2020

Diamond Member
Mar 3, 2013
91,608
62,424
2,605
Right coast, classified
I blame greenhouse gasses from industry.

image.jpeg


Solar activity crashes – the Sun looks like a cueball

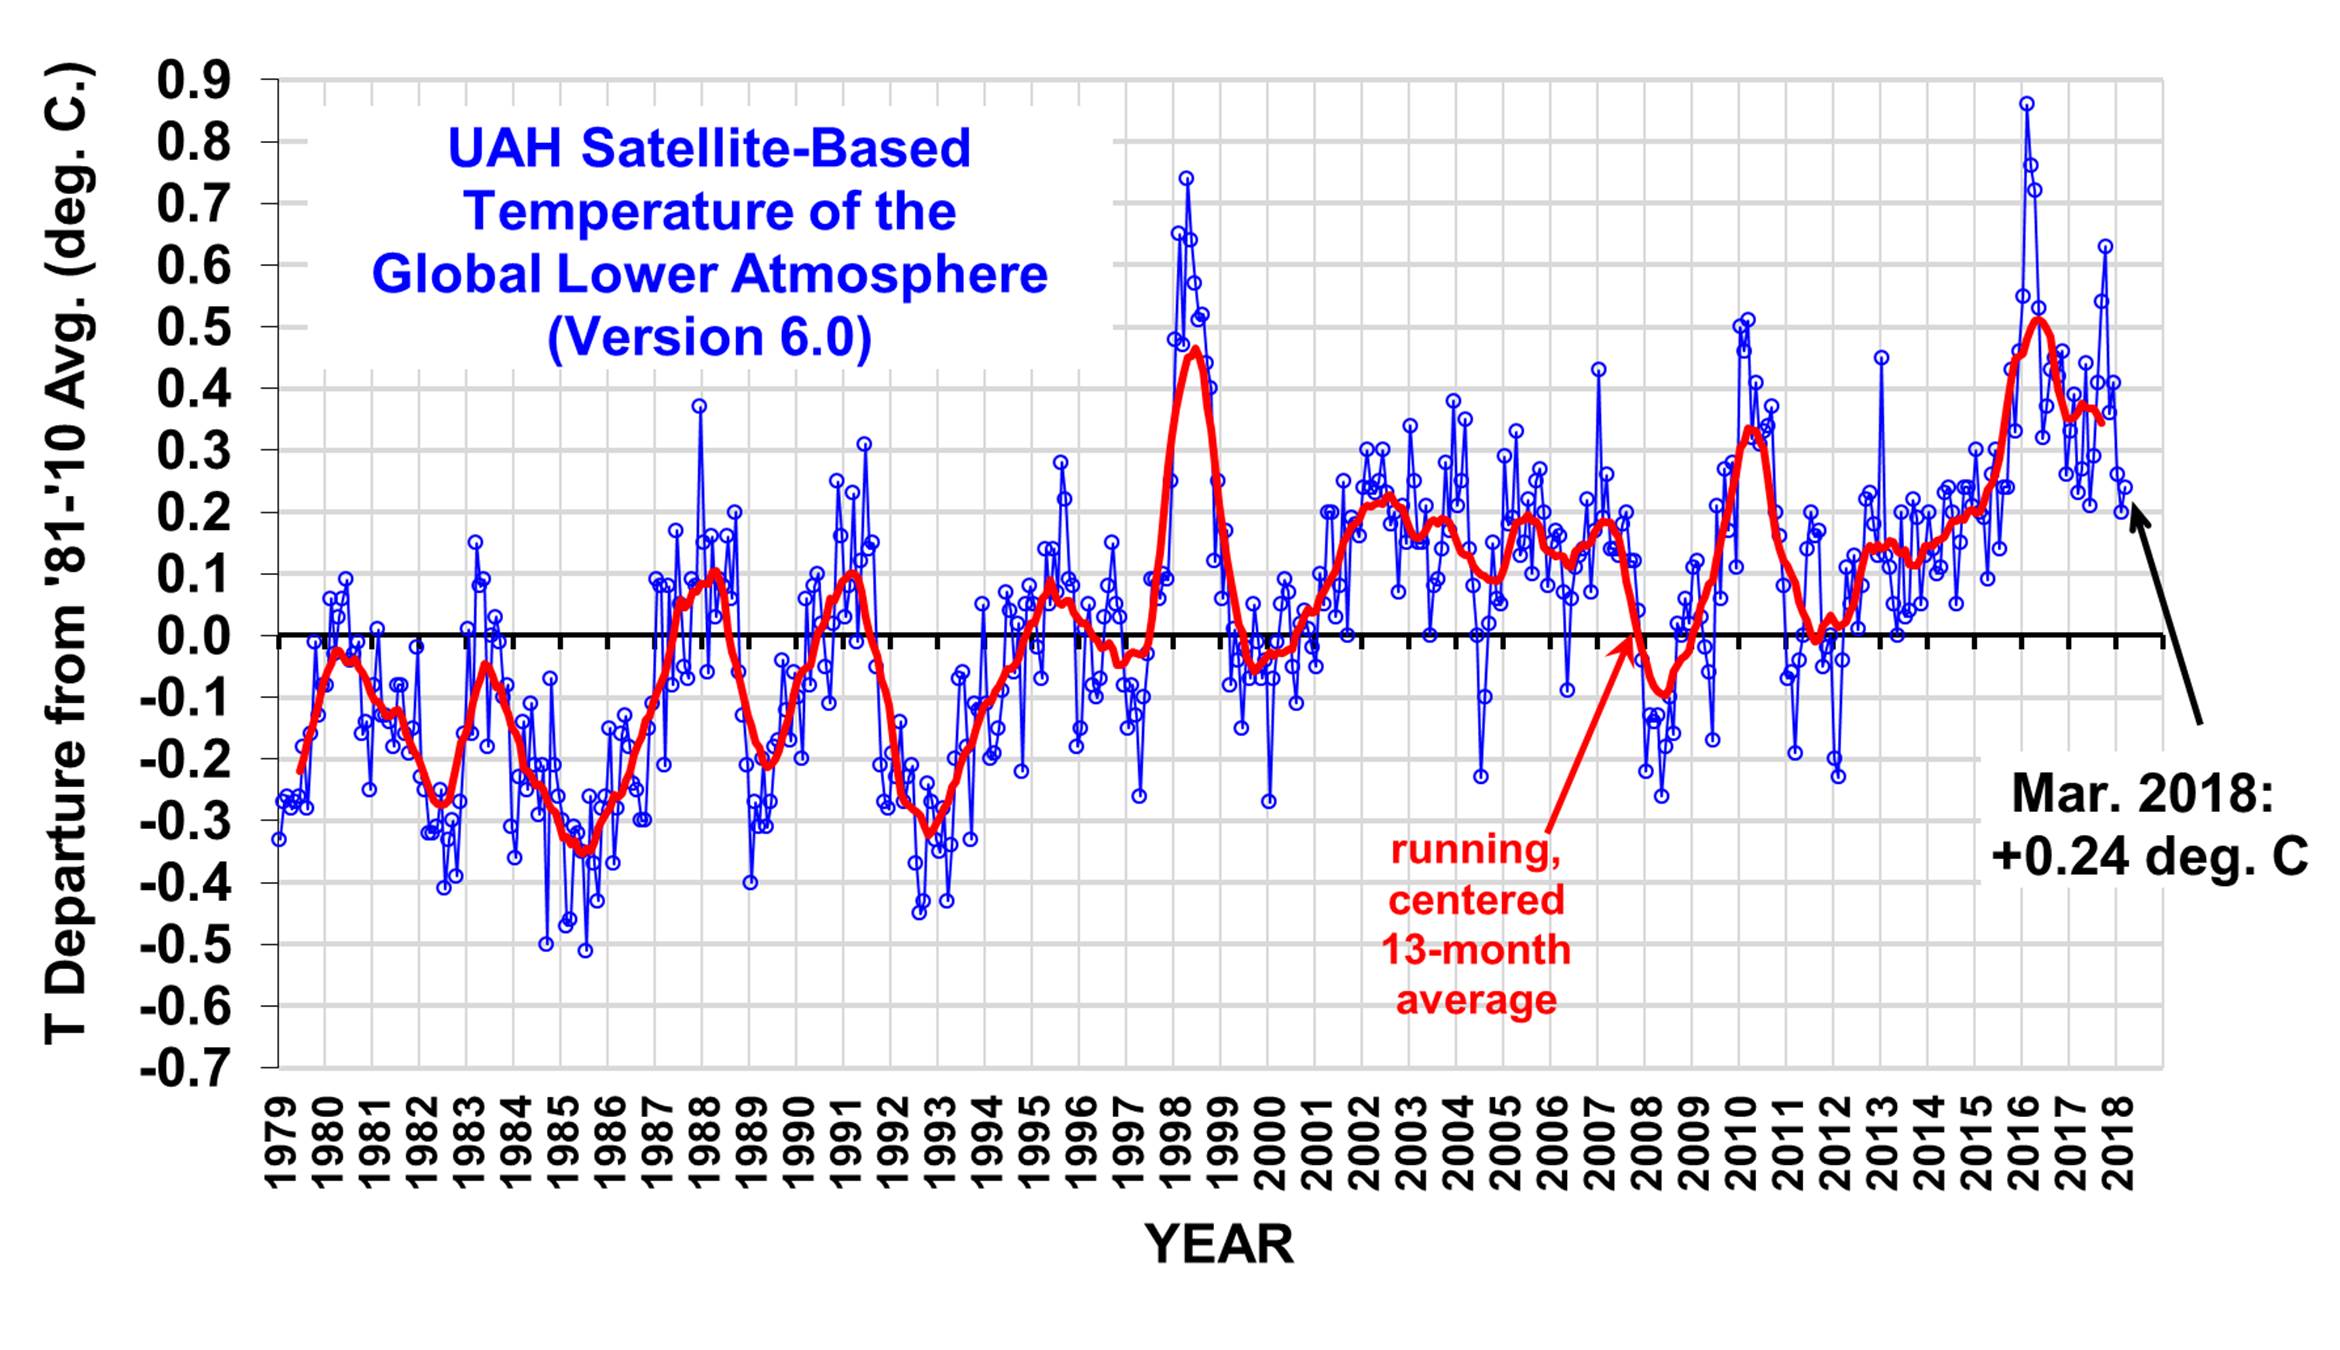
Related: Atmospheric Temperatures In Free Fall, Ocean Surfaces Cooling Off
 
So the polar ice sheets that are smaller than in 1000 years are an anomaly? That the thickness of glaciers are at all time record thinness. Whack job internet sites.
 
ncomms7491-f4.jpg


Figure 4: Variability in the total solar irradiance over the past three decades in comparison with the variance in components of the solar spectral irradiance over solar cycle 23.

UAH_LT_1979_thru_March_2018_v6.jpg

http://www.drroyspencer.com/wp-content/uploads/UAH_LT_1979_thru_March_2018_v6.jpg

Now look at the first graph on the TSI. Then at the global temperature graph from UAH. Does the UAH graph go down as the TSI does? Pretty easy to see it does not. We just finished a moderate La Nina, yet the lowest the UAH graph went down to was 0.2 That is well above the vast majority of temperatures prior to 1997.
 
I just love the squiggly graphs that foretell our doom.
 
So the polar ice sheets that are smaller than in 1000 years are an anomaly? That the thickness of glaciers are at all time record thinness. Whack job internet sites.
80 years after Capt Vancouver charted the area of Glacier Bay the mile thick glacier had receded 60 miles.

Before the first fossil fuel engine ever went bang.
 
ncomms7491-f4.jpg


Figure 4: Variability in the total solar irradiance over the past three decades in comparison with the variance in components of the solar spectral irradiance over solar cycle 23.

UAH_LT_1979_thru_March_2018_v6.jpg

http://www.drroyspencer.com/wp-content/uploads/UAH_LT_1979_thru_March_2018_v6.jpg

Now look at the first graph on the TSI. Then at the global temperature graph from UAH. Does the UAH graph go down as the TSI does? Pretty easy to see it does not. We just finished a moderate La Nina, yet the lowest the UAH graph went down to was 0.2 That is well above the vast majority of temperatures prior to 1997.

It is cooler today than in 1998.......

Boom, there goes your entire comment!
 
So the polar ice sheets that are smaller than in 1000 years are an anomaly? That the thickness of glaciers are at all time record thinness. Whack job internet sites.

Actually the current North Polar Ice cover is among the largest of the entire interglacial period. You only left out about 10,000 years of the interglacial, in your silly comment.
 
ncomms7491-f4.jpg


Figure 4: Variability in the total solar irradiance over the past three decades in comparison with the variance in components of the solar spectral irradiance over solar cycle 23.

UAH_LT_1979_thru_March_2018_v6.jpg

http://www.drroyspencer.com/wp-content/uploads/UAH_LT_1979_thru_March_2018_v6.jpg

Now look at the first graph on the TSI. Then at the global temperature graph from UAH. Does the UAH graph go down as the TSI does? Pretty easy to see it does not. We just finished a moderate La Nina, yet the lowest the UAH graph went down to was 0.2 That is well above the vast majority of temperatures prior to 1997.
La Niña now is the entire global oceans?

Fact is, and your chart shows it, global lower atmosphere temperature is lower today than it was in 1998.
 
How can anyone believe that the Sun has any meaningful impact on our climate?

Ain't that right Mr. I post a chart showing no warming for 2 decades as proof of global warming
 
So the polar ice sheets that are smaller than in 1000 years are an anomaly? That the thickness of glaciers are at all time record thinness. Whack job internet sites.

Actually the current North Polar Ice cover is among the largest of the entire interglacial period. You only left out about 10,000 years of the interglacial, in your silly comment.
Polar Ice Is Disappearing, Setting Off Climate Alarms
The short-term consequences of Arctic (and Antarctic) warming may already be felt in other latitudes. The long-term threat to coastlines is becoming even more dire.
By SABRINA SHANKMAN AND BOB BERWYN
Dec 27, 2017
:auiqs.jpg::auiqs.jpg::auiqs.jpg::auiqs.jpg::auiqs.jpg:

That's hilarious... they based their alarmism on a ........


MODEL!


I wonder if they even looked at the failure rate of their model before claiming this? Probably not....There is no Empirical Review stage of their modeling.

Nor is it possible. Just take a casual look at any work on Chaos even for the profoundly stupid and you can prove that weather/climate has a prediction horizon of less than 13 weeks even for the most predictable weather known.
 
So the polar ice sheets that are smaller than in 1000 years are an anomaly? That the thickness of glaciers are at all time record thinness. Whack job internet sites.

Actually the current North Polar Ice cover is among the largest of the entire interglacial period. You only left out about 10,000 years of the interglacial, in your silly comment.
Polar Ice Is Disappearing, Setting Off Climate Alarms
The short-term consequences of Arctic (and Antarctic) warming may already be felt in other latitudes. The long-term threat to coastlines is becoming even more dire.
By SABRINA SHANKMAN AND BOB BERWYN
Dec 27, 2017

Yawn......, Zzzz..............

They have been posting this crap for years now. it is misleading and boring.

The decline has stopped in 2007, been stable ever since, still low yes but no longer declining.

ARCTIC SEA ICE REMARKABLY STABLE SINCE 2007 – ‘193,000 sq miles higher than 10 years ago’
sept-monthly-2017final-1024x607.png
 
So the polar ice sheets that are smaller than in 1000 years are an anomaly? That the thickness of glaciers are at all time record thinness. Whack job internet sites.

Ha ha ha,

1,000 years ago was the last time there little to no summer ice, much lower than todays numbers. Yet Polar Bears are still here and the world didn't die at all at the 280 ppm level.

Taylor & Francis online

Birds and Climatic Change

Kenneth Williamson (1975) Birds and Climatic Change, Bird Study, 22:3,143-164, DOI: 10.1080/00063657509476459

Published online: 24 Jun 2009

“HISTORICAL REVIEW

Between 1000 and 1300 average summer temperatures were about 1°C higher than today, with the mean annual temperature higher by perhaps 4°C in a largely ice-free Arctic. Eric the Red, a renowned world citizen of that time, has been much maligned as the first progressive publicity man for giving Greenland a false image in order to attract settlers; but in truth, the southwest of that vast country was warmer and greener by far than at any time until the Fieldfares Turdus pilaris arrived there in the mid-1930s. The sea-temperature of the Atlantic was higher than it has been since, and there appears to have been none or very little ice to hinder the Vikings’ communications between Iceland, Greenland,Newfoundland and Labrador (Mowat 1965). Indeed Brooks (1926) considers that the polar ice-cap may have disappeared entirely during the summer months, to build anew each winter.”

LINK

Published peer reviewed research doesn't come from whack job internet sites....
 
So the polar ice sheets that are smaller than in 1000 years are an anomaly? That the thickness of glaciers are at all time record thinness. Whack job internet sites.

Actually the current North Polar Ice cover is among the largest of the entire interglacial period. You only left out about 10,000 years of the interglacial, in your silly comment.
Polar Ice Is Disappearing, Setting Off Climate Alarms
The short-term consequences of Arctic (and Antarctic) warming may already be felt in other latitudes. The long-term threat to coastlines is becoming even more dire.
By SABRINA SHANKMAN AND BOB BERWYN
Dec 27, 2017

Where is the link to this scaremongering crap?
 

Forum List

Back
Top