Socialism my ass

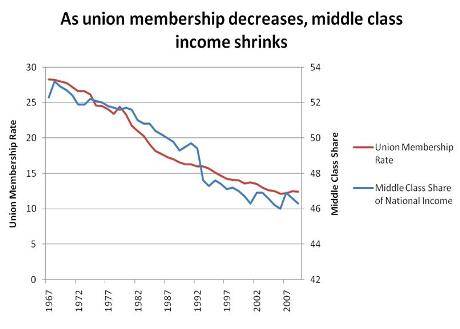
We used to be a nation where everybody shared in the wealth. Now...thanks to Reagan and the Bushes the corporations and wealthy own our ass:

6-25-10inc-f1.jpg
84216861.jpg


3.jpg


Corporations and the colossi wealthy--the less divinely blooded, American version of aristocracy have owned generations of our asses. You have been a commodity since birth, deal with it. And much the same as the rest of us, you've reveled in it by feeding corporations your hard earned dollars. We Americans surely do share the wealth. We earn our bantam take, and share it with corporations in return for the mass market products we cannot live without.
 
Pub dupes are so dumb. Greedy Pubs and Voodoo are killing the nonrich and the country. IE, YOU!!, dumbazzes.


The Demise of the American Middle Class In Numbers.

Over the past 60 years the American dream has gradually disappeared. The process was slow, so most people didn’t notice. They just worked a few more hours, borrowed a little more and cut back on non-essentials. But looking at the numbers and comparing them over long time periods, it is obvious that things have changed drastically. Here are the details:

1. WORKERS PRODUCE MORE BUT THE GAINS GO TO BUSINESS.

Over the past 63 years worker productivity has grown by 2.0% per year.

But after 1980, workers received a smaller share every year. Labor’s share of income (1992 = 100%):

1950 = 101%
1960 = 105%
1970 = 105%
1980 = 105% – Reagan
1990 = 100%
2000 = 96%
2007 = 92%

A 13% drop since 1980

2. THE TOP 10% GET A LARGER SHARE.

Share of National Income going to Top 10%:

1950 = 35%
1960 = 34%
1970 = 34%
1980 = 34% – Reagan
1990 = 40%
2000 = 47%
2007 = 50%

An increase of 16% since Reagan.

3. WORKERS COMPENSATED FOR THE LOSS OF INCOME BY SPENDING THEIR SAVINGS.

The savings Rose up to Reagan and fell during and after.

1950 = 6.0%
1960 = 7.0%
1970 = 8.5%
1980 = 10.0% – Reagan
1982 = 11.2% – Peak
1990 = 7.0%
2000 = 2.0%
2006 = -1.1% (Negative = withdrawing from savings)

A 12.3% drop after Reagan.

4. WORKERS ALSO BORROWED TO MAKE UP FOR THE LOSS.

Household Debt as percentage of GDP:

1965 = 46%
1970 = 45%
1980 = 50% – Reagan
1990 = 61%
2000 = 69%
2007 = 95%

A 45% increase after 1980.

5. SO THE GAP BETWEEN THE RICHEST AND THE POOREST HAS GROWN.

Gap Between the Share of Capital Income earned by the top 1%
and the bottom 80%:

1980 = 10%
2003 = 56%

A 5.6 times increase.

6. AND THE AMERICAN DREAM IS GONE.

The Probably of Moving Up from the Bottom 40% to the Top 40%:

1945 = 12%
1958 = 6%
1990 = 3%
2000 = 2%

The Demise of the American Middle Class In Numbers. | Fact Left
 
I've grown accustomed to most people not understanding what the word socialist or socialism means. To me it's just become a code word for black.

I've grown accustomed to liberal turds like you claiming that anyone who objects to socialism doesn't know what it is. Of course, you never explain where our understanding goes astray, or if you do you quickly get pounded into the ground.
 
Pub dupes are so dumb. Greedy Pubs and Voodoo are killing the nonrich and the country. IE, YOU!!, dumbazzes.


The Demise of the American Middle Class In Numbers.

Over the past 60 years the American dream has gradually disappeared. The process was slow, so most people didn’t notice. They just worked a few more hours, borrowed a little more and cut back on non-essentials. But looking at the numbers and comparing them over long time periods, it is obvious that things have changed drastically. Here are the details:

1. WORKERS PRODUCE MORE BUT THE GAINS GO TO BUSINESS.

Over the past 63 years worker productivity has grown by 2.0% per year.

But after 1980, workers received a smaller share every year. Labor’s share of income (1992 = 100%):

1950 = 101%
1960 = 105%
1970 = 105%
1980 = 105% – Reagan
1990 = 100%
2000 = 96%
2007 = 92%

A 13% drop since 1980

2. THE TOP 10% GET A LARGER SHARE.

Share of National Income going to Top 10%:

1950 = 35%
1960 = 34%
1970 = 34%
1980 = 34% – Reagan
1990 = 40%
2000 = 47%
2007 = 50%

An increase of 16% since Reagan.

3. WORKERS COMPENSATED FOR THE LOSS OF INCOME BY SPENDING THEIR SAVINGS.

The savings Rose up to Reagan and fell during and after.

1950 = 6.0%
1960 = 7.0%
1970 = 8.5%
1980 = 10.0% – Reagan
1982 = 11.2% – Peak
1990 = 7.0%
2000 = 2.0%
2006 = -1.1% (Negative = withdrawing from savings)

A 12.3% drop after Reagan.

4. WORKERS ALSO BORROWED TO MAKE UP FOR THE LOSS.

Household Debt as percentage of GDP:

1965 = 46%
1970 = 45%
1980 = 50% – Reagan
1990 = 61%
2000 = 69%
2007 = 95%

A 45% increase after 1980.

5. SO THE GAP BETWEEN THE RICHEST AND THE POOREST HAS GROWN.

Gap Between the Share of Capital Income earned by the top 1%
and the bottom 80%:

1980 = 10%
2003 = 56%

A 5.6 times increase.

6. AND THE AMERICAN DREAM IS GONE.

The Probably of Moving Up from the Bottom 40% to the Top 40%:

1945 = 12%
1958 = 6%
1990 = 3%
2000 = 2%

The Demise of the American Middle Class In Numbers. | Fact Left

And when Reagan busted PATCO it was the beginning of the end of middle class benefits. We're headed back to a time when ordinary folks will ultimately "Owe Their Souls To The Company Store"

Union-and-Middle-Class.jpeg
 

Forum List

Back
Top