
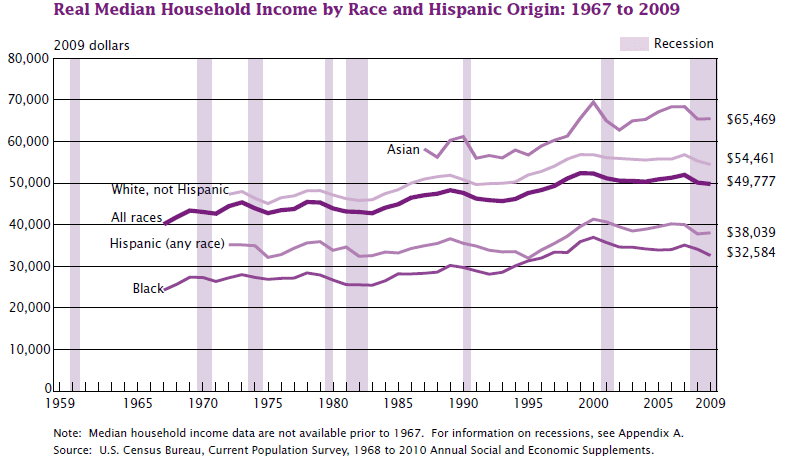
It has been the best of times for corporate profits, but rather less so for consumer incomes. Corporate earnings have soared 200% since 1990 while real median family incomes have increased by only 2%.
These data come from a recent article entitled, "High Profit Margins and Stagnant Real Incomes: Is Capitalism Working Properly?"
It didn't appear in The Nation but rather in The Bank Credit Analyst, the highly respected, long-time financial and economic research service that would never be thought of as some hotbed of populist fervor. And the author is not Michael Moore but Martin Barnes, the Bank Credit Analyst's long-time managing editor and self-described "dour Scot."
Moreover, rather than calling for a storming of the ramparts, Barnes poses questions of concern for the most self-interested of capitalists. Can the current high level of profit margins be maintained? Even more basically, can the corporate sector continue to prosper while the average consumer struggles?
What's stunning about the current cycle is that, despite a weak economic recovery, profit margins are near historic highs, albeit short of their historic peak in 2005. A major driver has been earnings from abroad, which have increased to 35% of total U.S. company profits from 20% since 1999.
Bottom line, the main factors that have propelled corporate profitscost-cutting, financial profits and overseas earningsare waning. Even so, companies have done a far sight better than workers, as noted earlier. Since 2000, they've fallen even further behind; profits are up 70% while real median family incomes are down 2%.
Part of that has been because consumer prices have risen faster than corporate selling prices, which reflect costs of capital goods which have been held down by technology, Barnes notes. "However, it seems clear that labor has not received its fair share in recent years, even when using corporate prices," he adds, falling 4% short of what would be expected based on productivity gains.
"Ultimately, the health of the corporate sector depends on the financial health of its customers. Thus, the divergence between rising profits and weak growth in real consumer incomes will have to change," Barnes asserts.
Corporate Profit Gains at Labor's Expense May be Hitting Limit - Barrons.com

 /sarcasm
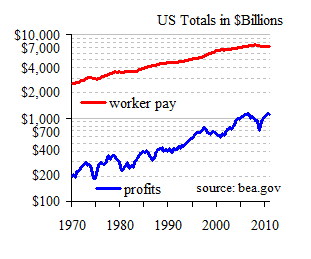
") .
.