Simple Question for Those Who Subscribe to AGW....

Status
Not open for further replies.
Why do you say that?


That's what implied or is earth only 100 years old?
That's what you read not what is implied.

So we had space stuff a hundred years ago or Mann's temperature reading tree rings?
The exert did not claim they had satellites a hundred years ago. It claimed it can and has measured the greenhouse effect using satellites. It's your typical strawman you are trying to use here.


?

Finnish study finds ‘practically no’ evidence for man-made climate change

A new study conducted by a Finnish research team has found little evidence to support the idea of man-made climate change. The results of the study were soon corroborated by researchers in Japan.
In a paper published late last month, entitled ‘No experimental evidence for the significant anthropogenic climate change’, a team of scientists at Turku University in Finland determined that current climate models fail to take into account the effects of cloud coverage on global temperatures, causing them to overestimate the impact of human-generated greenhouse gasses.

Models used by official bodies such as the Intergovernmental Panel on Climate Change (IPCC) “cannot compute correctly the natural component included in the observed global temperature,” the study said, adding that “a strong negative feedback of the clouds is missing” in the models.


Clouds? Who said anything about clouds???
Ureka!!!!!! Scientist just found out clouds cover Greenland!!!
 
What physical evidence supports the contention that carbon dioxide emissions from burning fossil fuels are the principal cause of global warming since 1970?

If you have it....lets see it. If you don't....then lets hear your best excuse for not providing it.
http://www.pas.va/content/dam/accademia/pdf/acta22/acta22-ramanathan.pdf
Here you go


OK...lets continue.

Regarding his "measurements" of the thickness of the "greenhouse blanket"...what crap. Any claim of heat "trapping" ability of additional CO2, and the resulting reduction of outgoing long wave radiation at the top of the atmosphere come with them an inherent necessity of an upper tropospheric hot spot. If energy is being trapped in the atmosphere, then that energy will have a fingerprint in the troposphere...trapped energy will produce a hot spot according to climate science. The fact is that there is no hot spot....


hot-spot-model-predicted.gif


And if the greenhouse gasses in the atmosphere were actually trapping energy, then the amount of energy leaving the earth at the top of the atmosphere would be reduced. It hasn't been. In fact, satellites have detected an increase in outgoing long wave radiation, and the increase has been going on for quite some time. Here, as measured by NOAA...


noaa-northern-hemisphere-olr-monthly-anomalies.png


Next, your author goes into an analysis of how much CO2 we have added to the atmosphere...Do keep in mind that so far, no actual evidence and not a single paper has been published in which the claimed warming due to our activities has been empirically measured, quantified, and blamed on greenhouse gasses....so any effort to show our contribution to CO2 gasses as evidence that we are causing warming is nothing more than evidence of increased CO2 with a big assed assumption that more CO2 causes warming tacked on.

But lets look at the CO2 increases and our influence on them. He simply makes an assumption that we are the cause of the increased CO2 in the atmosphere. The actual published science tells an entirely different story. The published science says that our contribution to the total atmospheric CO2 is so vanishingly small that it is essentially undetectable in the background noise...


Here are numerous peer reviewed, published studies which show very clearly that our effect on the total atmospheric CO2 is largely unmeasurable.. human beings, with all our CO2 producing capacity don't even make enough CO2 to overcome the year to year variation in the earth's own CO2 making machinery...

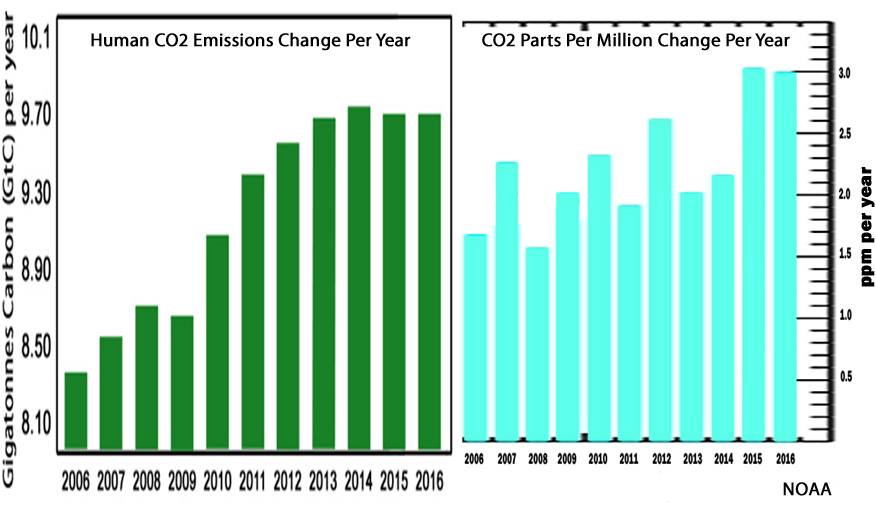
The fact is that the amount of CO2 we produce from year to year does not track with the amount of increase in atmospheric CO2.

https://www.researchgate.net/public...SPHERIC_CO2_TO_ANTHROPOGENIC_EMISSIONS_A_NOTE

CLIP: “A necessary condition for the theory of anthropogenic global warming is that there should be a close correlation between annual fluctuations of atmospheric CO2 and the annual rate of anthropogenic CO2 emissions. Data on atmospheric CO2 and anthropogenic emissions provided by the Mauna Loa measuring station and the CDIAC in the period 1959-2011 were studied using detrended correlation analysis to determine whether, net of their common long term upward trends, the rate of change in atmospheric CO2 is responsive to the rate of anthropogenic emissions in a shorter time scale from year to year. … [R]esults do not indicate a measurable year to year effect of annual anthropogenic emissions on the annual rate of CO2 accumulation in the atmosphere.”


CO2-Emissions-vs-CO2-ppm-concentration.jpg


If you look at the graph...assuming that you can read a graph...you will see for example, that there was a rise in our emissions between 2007 and 2008 but a significant decline in the atmospheric CO2 concentration. Do you believe that human CO2 went somewhere to hide and waited around for some years before it decided to have an effect on the total atmospheric CO2 concentration? Then between 2008 and 2009, there was a decline in the amount of CO2 that humans emitted into the atmosphere, but a significant rise in the atmospheric CO2 concentration. Then from 2010 to 2014 there was a large rise in man made CO2 emissions but an overall flat to declining trend in the atmospheric CO2 concentration. Between 2014 to 2016 there was a slight decline in man made CO2 emissions, but a pronounced rise in the atmospheric CO2 concentrations. Like I said, we produce just a fraction of the natural variation in the earth's own CO2 making machinery from year to year and we are learning that we really don't even have a handle on how much CO2 the earth is producing...the undersea volcanoes are a prime example of how much we don't know.


https://www2.meteo.uni-bonn.de/bibliothek/Flohn_Publikationen/K287-K320_1981-1985/K299.pdf

CLIP: The recent increase of the CO2-content of air varies distinctly from year to year, rather independent from the irregular annual increase of global CO2-production from fossil fuel and cement, which has since 1973 decreased from about 4.5 percent to 2.25 percent per year (Rotty 1981).”

Comparative investigations (Keeling and Bacastow 1977, Newll et al. 1978, Angell 1981) found a positive correlation between the rate of increase of atmospheric CO2 and the fluctuations of sea surface temperature (SST) in the equatorial Pacific, which are caused by rather abrupt changes between upwelling cool water and downwelling warm water (“El Niño”) in the eastern equatorial Pacific. Indeed the cool upwelling water is not only rich in (anorganic) CO2 but also in nutrients and organisms. (algae) which consume much atmospheric CO2 in organic form, thus reducing the increase in atmospehreic CO2. Conversely the warm water of tropical oceans, with SST near 27°C, is barren, thus leading to a reduction of CO2 uptake by the ocean and greater increase of the CO2. … A crude estimate of these differences is demonstrated by the fact that during the period 1958-1974, the average CO2-increase within five selective years with prevailing cool water only 0.57 ppm/a [per year], while during five years with prevailing warm water it was 1.11 ppm/a. Thus in a a warm water year, more than one Gt (1015 g) carbon is additionally injected into the atmosphere, in comparison to a cold water year.”


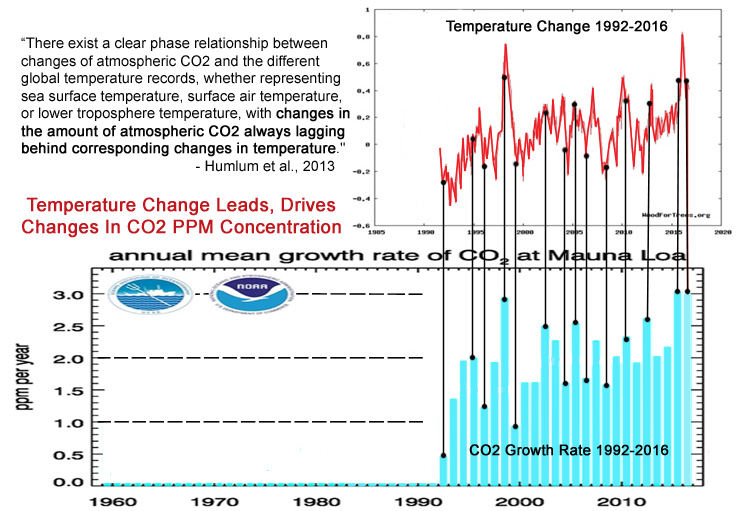
Practically every actual study ever done tells us that increases in CO2 follow increases in temperature...that means that increased CO2 is the result of increased temperature, not the cause of increased temperature...which makes sense since warm oceans hold less CO2 and as they warm, they outages CO2.

https://www.researchgate.net/public...spheric_carbon_dioxide_and_global_temperature

Temperature-Change-Leads-CO2-Growth-Change.jpg


CLIP"
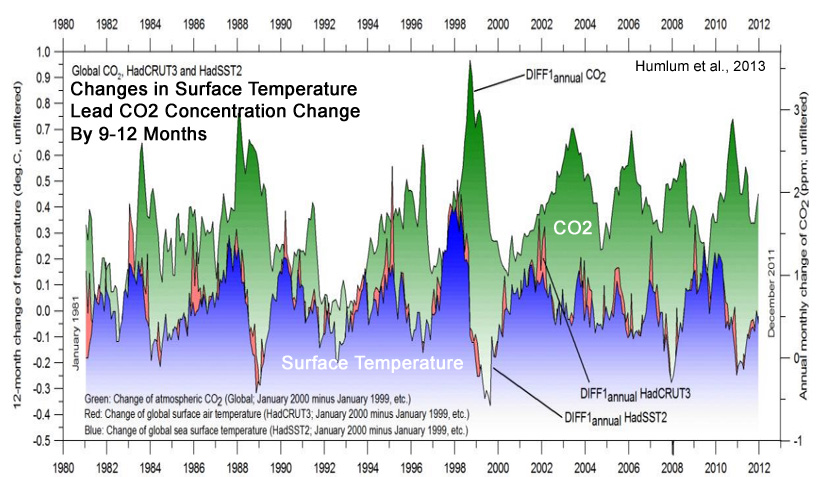
“There exist a clear phase relationship between changes of atmospheric CO2 and the different global temperature records, whether representing sea surface temperature, surface air temperature, or lower troposphere temperature, with changes in the amount of atmospheric CO2 always lagging behind corresponding changes in temperature.”

(1) The overall global temperature change sequence of events appears to be from 1) the ocean surface to 2) the land surface to 3) the lower troposphere.

(2) Changes in global atmospheric CO2 are lagging about 11–12 months behind changes in global sea surface temperature.

(3) Changes in global atmospheric CO2 are lagging 9.5–10 months behind changes in global air surface temperature.

(4) Changes in global atmospheric CO2 are lagging about 9 months behind changes in global lower troposphere temperature.

(5) Changes in ocean temperatures appear to explain a substantial part of the observed changes in atmospheric CO2 since January 1980.

(6) CO2 released from anthropogenic sources apparently has little influence on the observed changes in atmospheric CO2, and changes in atmospheric CO2 are not tracking changes in human emissions.

(7) On the time scale investigated, the overriding effect of large volcanic eruptions appears to be a reduction of atmospheric CO2, presumably due to the dominance of associated cooling effects from clouds associated with volcanic gases/aerosols and volcanic debris.

(8) Since at least 1980 changes in global temperature, and presumably especially southern ocean temperature, appear to represent a major control on changes in atmospheric CO2.

Temperature-Change-Leads-CO2-Growth-Change-Humulum-2013.jpg


SAGE Journals: Your gateway to world-class research journals

CLIP: “[T]he warming and cooling of the ocean waters control how much CO2 is exchanged with atmosphere and thereby controlling the concentration of atmospheric CO2. It is obvious that when the oceans are cooled, in this case due to volcanic eruptions or La Niña events, they release less CO2 and when it was an extremely warm year, due to an El Niño, the oceans release more CO2. [D]uring the measured time 1979 to 2006 there has been a continued natural increase in temperature causing a continued increase of CO2 released into the atmosphere. This implies that temperature variations caused by El Niños, La Niñas, volcanic eruptions, varying cloud formations and ultimately the varying solar irradiation control the amount of CO2 which is leaving or being absorbed by the oceans.”


https://pubs.acs.org/doi/abs/10.1021/ef800581r

CLIP: “[With the short (5−15 year) RT [residence time] results shown to be in quasi-equilibrium, this then supports the (independently based) conclusion that the long-term (∼100 year) rising atmospheric CO2 concentration is not from anthropogenic sources but, in accordance with conclusions from other studies, is most likely the outcome of the rising atmospheric temperature, which is due to other natural factors. This further supports the conclusion that global warming is not anthropogenically driven as an outcome of combustion.”


Error - Cookies Turned Off

“[T]he trend in the airborne fraction [ratio of CO2 accumulating in the atmosphere to the CO2 flux into the atmosphere due to human activity] since 1850 has been 0.7 ± 1.4% per decade, i.e. close to and not significantly different from zero. The analysis further shows that the statistical model of a constant airborne fraction agrees best with the available data if emissions from land use change are scaled down to 82% or less of their original estimates. Despite the predictions of coupled climate-carbon cycle models, no trend in the airborne fraction can be found.”

Like it or not, that last sentence means that there simply is not a discernible trend in the percentage of atmospheric CO2 that can be linked to our emissions...that is because in the grand scheme of things, the amount of CO2 that we produce is very small...not even enough to have any measurable effect on the year to year variation of the earth's own CO2 making processes...

Here is a paper from James Hansen himself...the father of global warming and the high priest of anthropogenic climate change...

Climate forcing growth rates: doubling down on our Faustian bargain - IOPscience

CLIP: “However, it is the dependence of the airborne fraction on fossil fuel emission rate that makes the post-2000 downturn of the airborne fraction particularly striking. The change of emission rate in 2000 from 1.5% yr-1 [1960-2000] to 3.1% yr-1 [2000-2011], other things being equal, would [should] have caused a sharp increase of the airborne fraction”

erl459410f3_online.jpg


Then he goes on to note that it has warmed since the little ice age, and makes a big assed assumption that the reason that it has warmed is CO2...and as evidence that it is CO2, he points to an 18th century thought experiment... The fact is that every ice core ever done shows us that increased atmospheric CO2 is the result of warming temperatures, not the cause...

Hell your guy even calls the output of computer models "empirical evidence" NEWSFLASH...it isn't.

Thanks for trying, but alas, there is nothing there but assumption after assumption after assumption being called empirical evidence...he does provide some actual instrumental data, but that is nothing more than evidence that he is easily fooled by instrumentation. It is in the section where he supposedly shows measurements of back radiation...energy moving from the cooler atmosphere down to the warmer surface of the earth where said radiation actually warms the surface... Ever look at the second law of thermodynamics? Here...take a look:


Second Law of Thermodynamics: It is not possible for heat to flow from a colder body to a warmer body without any work having been done to accomplish this flow. Energy will not flow spontaneously from a low temperature object to a higher temperature object.

Which part of that suggests that energy will move from the cooler atmosphere down to the warmer surface of the earth? He uses instruments that are cooled to a temperature of about -80F. He isn't measuring energy moving from the cooler atmosphere to the warmer surface of the earth...he is measuring energy moving from the warmer atmosphere to the cooler instrument....if you place an identical instrument with the cooling turned off right next to the cooled one, you will get no measurement of energy moving from the cooler atmosphere to the warmer instrument because according to the second law of thermodynamics (the mother of all physical laws) energy won't move spontaneously from a cool object to a warmer object....

It is always interesting to see what passes for evidence among those who believe...at least this one isn't an opinion piece from a newspaper as most provide....it is at least pseudoscience masquerading as science.....
Let's not continue. You can not make a claim about something and then continue about something else when you can't defend that claim.
You said that Venus is hot because of the pressure of its atmosphere and used gas giants to defend it. I pointed out that Jupiter's pressure to temperature is 0.0066 percent. Venus has a ratio of 64 percent.
Why do you say that?


That's what implied or is earth only 100 years old?
That's what you read not what is implied.

So we had space stuff a hundred years ago or Mann's temperature reading tree rings?
The exert did not claim they had satellites a hundred years ago. It claimed it can and has measured the greenhouse effect using satellites. It's your typical strawman you are trying to use here.


?

Finnish study finds ‘practically no’ evidence for man-made climate change

A new study conducted by a Finnish research team has found little evidence to support the idea of man-made climate change. The results of the study were soon corroborated by researchers in Japan.
In a paper published late last month, entitled ‘No experimental evidence for the significant anthropogenic climate change’, a team of scientists at Turku University in Finland determined that current climate models fail to take into account the effects of cloud coverage on global temperatures, causing them to overestimate the impact of human-generated greenhouse gasses.

Models used by official bodies such as the Intergovernmental Panel on Climate Change (IPCC) “cannot compute correctly the natural component included in the observed global temperature,” the study said, adding that “a strong negative feedback of the clouds is missing” in the models.
The paper attributes rising temperature during 1985–2005 almost entirely to decreasing low cloud cover, from which it infers a very low sensitivity of climate to rising CO2.

  1. Given that we have data for global climate, CO2 (from Law Dome ice cores before 1958), and total solar irradiance reconstructions, all covering the 169 years 1850–2018, the period 1985–2005 is going to contain a lot of spurious high frequency “chatter” in the signals most of which can be “tuned out” by considering far more data. When one does so, the combined influence of the sun and CO2 over 169 years explain climate far more accurately than is possible using only 20 years of data, with or without cloud cover data.
  2. For the period 1985-2005 they consider three variables: rising temperature, decreasing cloud cover, and rising CO2. Noting the negative correlation between the first two, their hypothesis is that the first is almost completely explained by the second. They conclude that there is therefore no need to implicate CO2 as a causal factor: even though CO2 has risen 47% during the industrial era, they claim it has a negligible effect on climate because that rise in temperature can be almost entirely attributed to cloud cover.
This line of reasoning is patently illogical: with equal logic one could prove that cloud cover has no significant effect on climate by attributing it all to CO2. Furthermore it is based purely on correlations over a short period and not on any physical mechanism such as the greenhouse effect that can be expected to remain valid over far longer periods than a mere 20 years.
Vaughan Pratt, Since 1972 taught classes on many topics at MIT and Stanford
https://www.quora.com/Why-is-Turku-...-the-significant-anthropogenic-climate-change
 
Sure, it does. That's why it's over 800 degrees Fahrenheit, while it's distance to the sun would make it at most 163 degrees Fahrenheit, without the greenhouse effect. I tell you what. Use CO2. Compress it to 1384 Psi and see if you can get it to 700 degrees Fahrenheit. Wich is the difference more or less between Venus temperature with or without the greenhouse effect. I know for a fact that CO2 is compressed in industry to a much higher pressure than 1348 Psi the temperature it generates doesn't even come close to 700 degrees Fahrenheit.

Once a dupe.....always a dupe apparently. Imagine...thinking a planet is a closed system...venus the energy escaping the top of the atmosphere in venus is the same as the energy it receives from the sun...We know that no energy is being "trapped" by the CO2 because the amount of energy going out is the same as the energy going in...that leaves nothing but the idea that CO2 is creating all that additional energy by itself...

What is that physical law about not being able to create or destroy energy?

Sorry guy...whoever it is that is giving you your opinion has done you a gross disservice...
 
That's what implied or is earth only 100 years old?
That's what you read not what is implied.

So we had space stuff a hundred years ago or Mann's temperature reading tree rings?
The exert did not claim they had satellites a hundred years ago. It claimed it can and has measured the greenhouse effect using satellites. It's your typical strawman you are trying to use here.


?

Finnish study finds ‘practically no’ evidence for man-made climate change

A new study conducted by a Finnish research team has found little evidence to support the idea of man-made climate change. The results of the study were soon corroborated by researchers in Japan.
In a paper published late last month, entitled ‘No experimental evidence for the significant anthropogenic climate change’, a team of scientists at Turku University in Finland determined that current climate models fail to take into account the effects of cloud coverage on global temperatures, causing them to overestimate the impact of human-generated greenhouse gasses.

Models used by official bodies such as the Intergovernmental Panel on Climate Change (IPCC) “cannot compute correctly the natural component included in the observed global temperature,” the study said, adding that “a strong negative feedback of the clouds is missing” in the models.


Clouds? Who said anything about clouds???
Ureka!!!!!! Scientist just found out clouds cover Greenland!!!
Did you see your own paper? That study you linked?
 
What physical evidence supports the contention that carbon dioxide emissions from burning fossil fuels are the principal cause of global warming since 1970?

If you have it....lets see it. If you don't....then lets hear your best excuse for not providing it.
http://www.pas.va/content/dam/accademia/pdf/acta22/acta22-ramanathan.pdf
Here you go


OK...lets continue.

Regarding his "measurements" of the thickness of the "greenhouse blanket"...what crap. Any claim of heat "trapping" ability of additional CO2, and the resulting reduction of outgoing long wave radiation at the top of the atmosphere come with them an inherent necessity of an upper tropospheric hot spot. If energy is being trapped in the atmosphere, then that energy will have a fingerprint in the troposphere...trapped energy will produce a hot spot according to climate science. The fact is that there is no hot spot....


hot-spot-model-predicted.gif


And if the greenhouse gasses in the atmosphere were actually trapping energy, then the amount of energy leaving the earth at the top of the atmosphere would be reduced. It hasn't been. In fact, satellites have detected an increase in outgoing long wave radiation, and the increase has been going on for quite some time. Here, as measured by NOAA...


noaa-northern-hemisphere-olr-monthly-anomalies.png


Next, your author goes into an analysis of how much CO2 we have added to the atmosphere...Do keep in mind that so far, no actual evidence and not a single paper has been published in which the claimed warming due to our activities has been empirically measured, quantified, and blamed on greenhouse gasses....so any effort to show our contribution to CO2 gasses as evidence that we are causing warming is nothing more than evidence of increased CO2 with a big assed assumption that more CO2 causes warming tacked on.

But lets look at the CO2 increases and our influence on them. He simply makes an assumption that we are the cause of the increased CO2 in the atmosphere. The actual published science tells an entirely different story. The published science says that our contribution to the total atmospheric CO2 is so vanishingly small that it is essentially undetectable in the background noise...


Here are numerous peer reviewed, published studies which show very clearly that our effect on the total atmospheric CO2 is largely unmeasurable.. human beings, with all our CO2 producing capacity don't even make enough CO2 to overcome the year to year variation in the earth's own CO2 making machinery...

The fact is that the amount of CO2 we produce from year to year does not track with the amount of increase in atmospheric CO2.

https://www.researchgate.net/public...SPHERIC_CO2_TO_ANTHROPOGENIC_EMISSIONS_A_NOTE

CLIP: “A necessary condition for the theory of anthropogenic global warming is that there should be a close correlation between annual fluctuations of atmospheric CO2 and the annual rate of anthropogenic CO2 emissions. Data on atmospheric CO2 and anthropogenic emissions provided by the Mauna Loa measuring station and the CDIAC in the period 1959-2011 were studied using detrended correlation analysis to determine whether, net of their common long term upward trends, the rate of change in atmospheric CO2 is responsive to the rate of anthropogenic emissions in a shorter time scale from year to year. … [R]esults do not indicate a measurable year to year effect of annual anthropogenic emissions on the annual rate of CO2 accumulation in the atmosphere.”


CO2-Emissions-vs-CO2-ppm-concentration.jpg


If you look at the graph...assuming that you can read a graph...you will see for example, that there was a rise in our emissions between 2007 and 2008 but a significant decline in the atmospheric CO2 concentration. Do you believe that human CO2 went somewhere to hide and waited around for some years before it decided to have an effect on the total atmospheric CO2 concentration? Then between 2008 and 2009, there was a decline in the amount of CO2 that humans emitted into the atmosphere, but a significant rise in the atmospheric CO2 concentration. Then from 2010 to 2014 there was a large rise in man made CO2 emissions but an overall flat to declining trend in the atmospheric CO2 concentration. Between 2014 to 2016 there was a slight decline in man made CO2 emissions, but a pronounced rise in the atmospheric CO2 concentrations. Like I said, we produce just a fraction of the natural variation in the earth's own CO2 making machinery from year to year and we are learning that we really don't even have a handle on how much CO2 the earth is producing...the undersea volcanoes are a prime example of how much we don't know.


https://www2.meteo.uni-bonn.de/bibliothek/Flohn_Publikationen/K287-K320_1981-1985/K299.pdf

CLIP: The recent increase of the CO2-content of air varies distinctly from year to year, rather independent from the irregular annual increase of global CO2-production from fossil fuel and cement, which has since 1973 decreased from about 4.5 percent to 2.25 percent per year (Rotty 1981).”

Comparative investigations (Keeling and Bacastow 1977, Newll et al. 1978, Angell 1981) found a positive correlation between the rate of increase of atmospheric CO2 and the fluctuations of sea surface temperature (SST) in the equatorial Pacific, which are caused by rather abrupt changes between upwelling cool water and downwelling warm water (“El Niño”) in the eastern equatorial Pacific. Indeed the cool upwelling water is not only rich in (anorganic) CO2 but also in nutrients and organisms. (algae) which consume much atmospheric CO2 in organic form, thus reducing the increase in atmospehreic CO2. Conversely the warm water of tropical oceans, with SST near 27°C, is barren, thus leading to a reduction of CO2 uptake by the ocean and greater increase of the CO2. … A crude estimate of these differences is demonstrated by the fact that during the period 1958-1974, the average CO2-increase within five selective years with prevailing cool water only 0.57 ppm/a [per year], while during five years with prevailing warm water it was 1.11 ppm/a. Thus in a a warm water year, more than one Gt (1015 g) carbon is additionally injected into the atmosphere, in comparison to a cold water year.”


Practically every actual study ever done tells us that increases in CO2 follow increases in temperature...that means that increased CO2 is the result of increased temperature, not the cause of increased temperature...which makes sense since warm oceans hold less CO2 and as they warm, they outages CO2.

https://www.researchgate.net/public...spheric_carbon_dioxide_and_global_temperature

Temperature-Change-Leads-CO2-Growth-Change.jpg


CLIP"
“There exist a clear phase relationship between changes of atmospheric CO2 and the different global temperature records, whether representing sea surface temperature, surface air temperature, or lower troposphere temperature, with changes in the amount of atmospheric CO2 always lagging behind corresponding changes in temperature.”

(1) The overall global temperature change sequence of events appears to be from 1) the ocean surface to 2) the land surface to 3) the lower troposphere.

(2) Changes in global atmospheric CO2 are lagging about 11–12 months behind changes in global sea surface temperature.

(3) Changes in global atmospheric CO2 are lagging 9.5–10 months behind changes in global air surface temperature.

(4) Changes in global atmospheric CO2 are lagging about 9 months behind changes in global lower troposphere temperature.

(5) Changes in ocean temperatures appear to explain a substantial part of the observed changes in atmospheric CO2 since January 1980.

(6) CO2 released from anthropogenic sources apparently has little influence on the observed changes in atmospheric CO2, and changes in atmospheric CO2 are not tracking changes in human emissions.

(7) On the time scale investigated, the overriding effect of large volcanic eruptions appears to be a reduction of atmospheric CO2, presumably due to the dominance of associated cooling effects from clouds associated with volcanic gases/aerosols and volcanic debris.

(8) Since at least 1980 changes in global temperature, and presumably especially southern ocean temperature, appear to represent a major control on changes in atmospheric CO2.

Temperature-Change-Leads-CO2-Growth-Change-Humulum-2013.jpg


SAGE Journals: Your gateway to world-class research journals

CLIP: “[T]he warming and cooling of the ocean waters control how much CO2 is exchanged with atmosphere and thereby controlling the concentration of atmospheric CO2. It is obvious that when the oceans are cooled, in this case due to volcanic eruptions or La Niña events, they release less CO2 and when it was an extremely warm year, due to an El Niño, the oceans release more CO2. [D]uring the measured time 1979 to 2006 there has been a continued natural increase in temperature causing a continued increase of CO2 released into the atmosphere. This implies that temperature variations caused by El Niños, La Niñas, volcanic eruptions, varying cloud formations and ultimately the varying solar irradiation control the amount of CO2 which is leaving or being absorbed by the oceans.”


https://pubs.acs.org/doi/abs/10.1021/ef800581r

CLIP: “[With the short (5−15 year) RT [residence time] results shown to be in quasi-equilibrium, this then supports the (independently based) conclusion that the long-term (∼100 year) rising atmospheric CO2 concentration is not from anthropogenic sources but, in accordance with conclusions from other studies, is most likely the outcome of the rising atmospheric temperature, which is due to other natural factors. This further supports the conclusion that global warming is not anthropogenically driven as an outcome of combustion.”


Error - Cookies Turned Off

“[T]he trend in the airborne fraction [ratio of CO2 accumulating in the atmosphere to the CO2 flux into the atmosphere due to human activity] since 1850 has been 0.7 ± 1.4% per decade, i.e. close to and not significantly different from zero. The analysis further shows that the statistical model of a constant airborne fraction agrees best with the available data if emissions from land use change are scaled down to 82% or less of their original estimates. Despite the predictions of coupled climate-carbon cycle models, no trend in the airborne fraction can be found.”

Like it or not, that last sentence means that there simply is not a discernible trend in the percentage of atmospheric CO2 that can be linked to our emissions...that is because in the grand scheme of things, the amount of CO2 that we produce is very small...not even enough to have any measurable effect on the year to year variation of the earth's own CO2 making processes...

Here is a paper from James Hansen himself...the father of global warming and the high priest of anthropogenic climate change...

Climate forcing growth rates: doubling down on our Faustian bargain - IOPscience

CLIP: “However, it is the dependence of the airborne fraction on fossil fuel emission rate that makes the post-2000 downturn of the airborne fraction particularly striking. The change of emission rate in 2000 from 1.5% yr-1 [1960-2000] to 3.1% yr-1 [2000-2011], other things being equal, would [should] have caused a sharp increase of the airborne fraction”

erl459410f3_online.jpg


Then he goes on to note that it has warmed since the little ice age, and makes a big assed assumption that the reason that it has warmed is CO2...and as evidence that it is CO2, he points to an 18th century thought experiment... The fact is that every ice core ever done shows us that increased atmospheric CO2 is the result of warming temperatures, not the cause...

Hell your guy even calls the output of computer models "empirical evidence" NEWSFLASH...it isn't.

Thanks for trying, but alas, there is nothing there but assumption after assumption after assumption being called empirical evidence...he does provide some actual instrumental data, but that is nothing more than evidence that he is easily fooled by instrumentation. It is in the section where he supposedly shows measurements of back radiation...energy moving from the cooler atmosphere down to the warmer surface of the earth where said radiation actually warms the surface... Ever look at the second law of thermodynamics? Here...take a look:


Second Law of Thermodynamics: It is not possible for heat to flow from a colder body to a warmer body without any work having been done to accomplish this flow. Energy will not flow spontaneously from a low temperature object to a higher temperature object.

Which part of that suggests that energy will move from the cooler atmosphere down to the warmer surface of the earth? He uses instruments that are cooled to a temperature of about -80F. He isn't measuring energy moving from the cooler atmosphere to the warmer surface of the earth...he is measuring energy moving from the warmer atmosphere to the cooler instrument....if you place an identical instrument with the cooling turned off right next to the cooled one, you will get no measurement of energy moving from the cooler atmosphere to the warmer instrument because according to the second law of thermodynamics (the mother of all physical laws) energy won't move spontaneously from a cool object to a warmer object....

It is always interesting to see what passes for evidence among those who believe...at least this one isn't an opinion piece from a newspaper as most provide....it is at least pseudoscience masquerading as science.....
Let's not continue. You can not make a claim about something and then continue about something else when you can't defend that claim.
You said that Venus is hot because of the pressure of its atmosphere and used gas giants to defend it. I pointed out that Jupiter's pressure to temperature is 0.0066 percent. Venus has a ratio of 64 percent.
That's what implied or is earth only 100 years old?
That's what you read not what is implied.

So we had space stuff a hundred years ago or Mann's temperature reading tree rings?
The exert did not claim they had satellites a hundred years ago. It claimed it can and has measured the greenhouse effect using satellites. It's your typical strawman you are trying to use here.


?

Finnish study finds ‘practically no’ evidence for man-made climate change

A new study conducted by a Finnish research team has found little evidence to support the idea of man-made climate change. The results of the study were soon corroborated by researchers in Japan.
In a paper published late last month, entitled ‘No experimental evidence for the significant anthropogenic climate change’, a team of scientists at Turku University in Finland determined that current climate models fail to take into account the effects of cloud coverage on global temperatures, causing them to overestimate the impact of human-generated greenhouse gasses.

Models used by official bodies such as the Intergovernmental Panel on Climate Change (IPCC) “cannot compute correctly the natural component included in the observed global temperature,” the study said, adding that “a strong negative feedback of the clouds is missing” in the models.
The paper attributes rising temperature during 1985–2005 almost entirely to decreasing low cloud cover, from which it infers a very low sensitivity of climate to rising CO2.

  1. Given that we have data for global climate, CO2 (from Law Dome ice cores before 1958), and total solar irradiance reconstructions, all covering the 169 years 1850–2018, the period 1985–2005 is going to contain a lot of spurious high frequency “chatter” in the signals most of which can be “tuned out” by considering far more data. When one does so, the combined influence of the sun and CO2 over 169 years explain climate far more accurately than is possible using only 20 years of data, with or without cloud cover data.
  2. For the period 1985-2005 they consider three variables: rising temperature, decreasing cloud cover, and rising CO2. Noting the negative correlation between the first two, their hypothesis is that the first is almost completely explained by the second. They conclude that there is therefore no need to implicate CO2 as a causal factor: even though CO2 has risen 47% during the industrial era, they claim it has a negligible effect on climate because that rise in temperature can be almost entirely attributed to cloud cover.
This line of reasoning is patently illogical: with equal logic one could prove that cloud cover has no significant effect on climate by attributing it all to CO2. Furthermore it is based purely on correlations over a short period and not on any physical mechanism such as the greenhouse effect that can be expected to remain valid over far longer periods than a mere 20 years.
Vaughan Pratt, Since 1972 taught classes on many topics at MIT and Stanford
https://www.quora.com/Why-is-Turku-...-the-significant-anthropogenic-climate-change


Oh really?


Winter monsoons became stronger during geomagnetic reversal: Revealing the impact of cosmic rays on the Earth's climate


The Svensmark Effect is a hypothesis that galactic cosmic rays induce low cloud formation and influence the Earth's climate. Tests based on recent meteorological observation data only show minute changes in the amounts of galactic cosmic rays and cloud cover, making it hard to prove this theory. However, during the last geomagnetic reversal transition, when the amount of galactic cosmic rays increased dramatically, there was also a large increase in cloud cover, so it should be possible to detect the impact of cosmic rays on climate at a higher sensitivity.

In the Chinese Loess Plateau, just south of the Gobi Desert near the border of Mongolia, dust has been transported for 2.6 million years to form loess layers -- sediment created by the accumulation of wind-blown silt -- that can reach up to 200 meters in thickness. If the wind gets stronger, the coarse particles are carried further, and larger amounts are transported. Focusing on this phenomenon, the research team proposed that winter monsoons became stronger under the umbrella effect of increased cloud cover during the geomagnetic reversal. They investigated changes in particle size and accumulation speed of loess layer dust in two Loess Plateau locations.
 
Sure, it does. That's why it's over 800 degrees Fahrenheit, while it's distance to the sun would make it at most 163 degrees Fahrenheit, without the greenhouse effect. I tell you what. Use CO2. Compress it to 1384 Psi and see if you can get it to 700 degrees Fahrenheit. Wich is the difference more or less between Venus temperature with or without the greenhouse effect. I know for a fact that CO2 is compressed in industry to a much higher pressure than 1348 Psi the temperature it generates doesn't even come close to 700 degrees Fahrenheit.

Once a dupe.....always a dupe apparently. Imagine...thinking a planet is a closed system...venus the energy escaping the top of the atmosphere in venus is the same as the energy it receives from the sun...We know that no energy is being "trapped" by the CO2 because the amount of energy going out is the same as the energy going in...that leaves nothing but the idea that CO2 is creating all that additional energy by itself...

What is that physical law about not being able to create or destroy energy?

Sorry guy...whoever it is that is giving you your opinion has done you a gross disservice...
Link the study that shows an equal amount of energy escaping Venus as it receives. Be my guest. You, by the way, have simply dodged my question. Show me a graph that shows that when you compress co2 to 1384 Psi you get an increase in temperature of 700 degrees F
 
What physical evidence supports the contention that carbon dioxide emissions from burning fossil fuels are the principal cause of global warming since 1970?

If you have it....lets see it. If you don't....then lets hear your best excuse for not providing it.
http://www.pas.va/content/dam/accademia/pdf/acta22/acta22-ramanathan.pdf
Here you go


OK...lets continue.

Regarding his "measurements" of the thickness of the "greenhouse blanket"...what crap. Any claim of heat "trapping" ability of additional CO2, and the resulting reduction of outgoing long wave radiation at the top of the atmosphere come with them an inherent necessity of an upper tropospheric hot spot. If energy is being trapped in the atmosphere, then that energy will have a fingerprint in the troposphere...trapped energy will produce a hot spot according to climate science. The fact is that there is no hot spot....


hot-spot-model-predicted.gif


And if the greenhouse gasses in the atmosphere were actually trapping energy, then the amount of energy leaving the earth at the top of the atmosphere would be reduced. It hasn't been. In fact, satellites have detected an increase in outgoing long wave radiation, and the increase has been going on for quite some time. Here, as measured by NOAA...


noaa-northern-hemisphere-olr-monthly-anomalies.png


Next, your author goes into an analysis of how much CO2 we have added to the atmosphere...Do keep in mind that so far, no actual evidence and not a single paper has been published in which the claimed warming due to our activities has been empirically measured, quantified, and blamed on greenhouse gasses....so any effort to show our contribution to CO2 gasses as evidence that we are causing warming is nothing more than evidence of increased CO2 with a big assed assumption that more CO2 causes warming tacked on.

But lets look at the CO2 increases and our influence on them. He simply makes an assumption that we are the cause of the increased CO2 in the atmosphere. The actual published science tells an entirely different story. The published science says that our contribution to the total atmospheric CO2 is so vanishingly small that it is essentially undetectable in the background noise...


Here are numerous peer reviewed, published studies which show very clearly that our effect on the total atmospheric CO2 is largely unmeasurable.. human beings, with all our CO2 producing capacity don't even make enough CO2 to overcome the year to year variation in the earth's own CO2 making machinery...

The fact is that the amount of CO2 we produce from year to year does not track with the amount of increase in atmospheric CO2.

https://www.researchgate.net/public...SPHERIC_CO2_TO_ANTHROPOGENIC_EMISSIONS_A_NOTE

CLIP: “A necessary condition for the theory of anthropogenic global warming is that there should be a close correlation between annual fluctuations of atmospheric CO2 and the annual rate of anthropogenic CO2 emissions. Data on atmospheric CO2 and anthropogenic emissions provided by the Mauna Loa measuring station and the CDIAC in the period 1959-2011 were studied using detrended correlation analysis to determine whether, net of their common long term upward trends, the rate of change in atmospheric CO2 is responsive to the rate of anthropogenic emissions in a shorter time scale from year to year. … [R]esults do not indicate a measurable year to year effect of annual anthropogenic emissions on the annual rate of CO2 accumulation in the atmosphere.”


CO2-Emissions-vs-CO2-ppm-concentration.jpg


If you look at the graph...assuming that you can read a graph...you will see for example, that there was a rise in our emissions between 2007 and 2008 but a significant decline in the atmospheric CO2 concentration. Do you believe that human CO2 went somewhere to hide and waited around for some years before it decided to have an effect on the total atmospheric CO2 concentration? Then between 2008 and 2009, there was a decline in the amount of CO2 that humans emitted into the atmosphere, but a significant rise in the atmospheric CO2 concentration. Then from 2010 to 2014 there was a large rise in man made CO2 emissions but an overall flat to declining trend in the atmospheric CO2 concentration. Between 2014 to 2016 there was a slight decline in man made CO2 emissions, but a pronounced rise in the atmospheric CO2 concentrations. Like I said, we produce just a fraction of the natural variation in the earth's own CO2 making machinery from year to year and we are learning that we really don't even have a handle on how much CO2 the earth is producing...the undersea volcanoes are a prime example of how much we don't know.


https://www2.meteo.uni-bonn.de/bibliothek/Flohn_Publikationen/K287-K320_1981-1985/K299.pdf

CLIP: The recent increase of the CO2-content of air varies distinctly from year to year, rather independent from the irregular annual increase of global CO2-production from fossil fuel and cement, which has since 1973 decreased from about 4.5 percent to 2.25 percent per year (Rotty 1981).”

Comparative investigations (Keeling and Bacastow 1977, Newll et al. 1978, Angell 1981) found a positive correlation between the rate of increase of atmospheric CO2 and the fluctuations of sea surface temperature (SST) in the equatorial Pacific, which are caused by rather abrupt changes between upwelling cool water and downwelling warm water (“El Niño”) in the eastern equatorial Pacific. Indeed the cool upwelling water is not only rich in (anorganic) CO2 but also in nutrients and organisms. (algae) which consume much atmospheric CO2 in organic form, thus reducing the increase in atmospehreic CO2. Conversely the warm water of tropical oceans, with SST near 27°C, is barren, thus leading to a reduction of CO2 uptake by the ocean and greater increase of the CO2. … A crude estimate of these differences is demonstrated by the fact that during the period 1958-1974, the average CO2-increase within five selective years with prevailing cool water only 0.57 ppm/a [per year], while during five years with prevailing warm water it was 1.11 ppm/a. Thus in a a warm water year, more than one Gt (1015 g) carbon is additionally injected into the atmosphere, in comparison to a cold water year.”


Practically every actual study ever done tells us that increases in CO2 follow increases in temperature...that means that increased CO2 is the result of increased temperature, not the cause of increased temperature...which makes sense since warm oceans hold less CO2 and as they warm, they outages CO2.

https://www.researchgate.net/public...spheric_carbon_dioxide_and_global_temperature

Temperature-Change-Leads-CO2-Growth-Change.jpg


CLIP"
“There exist a clear phase relationship between changes of atmospheric CO2 and the different global temperature records, whether representing sea surface temperature, surface air temperature, or lower troposphere temperature, with changes in the amount of atmospheric CO2 always lagging behind corresponding changes in temperature.”

(1) The overall global temperature change sequence of events appears to be from 1) the ocean surface to 2) the land surface to 3) the lower troposphere.

(2) Changes in global atmospheric CO2 are lagging about 11–12 months behind changes in global sea surface temperature.

(3) Changes in global atmospheric CO2 are lagging 9.5–10 months behind changes in global air surface temperature.

(4) Changes in global atmospheric CO2 are lagging about 9 months behind changes in global lower troposphere temperature.

(5) Changes in ocean temperatures appear to explain a substantial part of the observed changes in atmospheric CO2 since January 1980.

(6) CO2 released from anthropogenic sources apparently has little influence on the observed changes in atmospheric CO2, and changes in atmospheric CO2 are not tracking changes in human emissions.

(7) On the time scale investigated, the overriding effect of large volcanic eruptions appears to be a reduction of atmospheric CO2, presumably due to the dominance of associated cooling effects from clouds associated with volcanic gases/aerosols and volcanic debris.

(8) Since at least 1980 changes in global temperature, and presumably especially southern ocean temperature, appear to represent a major control on changes in atmospheric CO2.

Temperature-Change-Leads-CO2-Growth-Change-Humulum-2013.jpg


SAGE Journals: Your gateway to world-class research journals

CLIP: “[T]he warming and cooling of the ocean waters control how much CO2 is exchanged with atmosphere and thereby controlling the concentration of atmospheric CO2. It is obvious that when the oceans are cooled, in this case due to volcanic eruptions or La Niña events, they release less CO2 and when it was an extremely warm year, due to an El Niño, the oceans release more CO2. [D]uring the measured time 1979 to 2006 there has been a continued natural increase in temperature causing a continued increase of CO2 released into the atmosphere. This implies that temperature variations caused by El Niños, La Niñas, volcanic eruptions, varying cloud formations and ultimately the varying solar irradiation control the amount of CO2 which is leaving or being absorbed by the oceans.”


https://pubs.acs.org/doi/abs/10.1021/ef800581r

CLIP: “[With the short (5−15 year) RT [residence time] results shown to be in quasi-equilibrium, this then supports the (independently based) conclusion that the long-term (∼100 year) rising atmospheric CO2 concentration is not from anthropogenic sources but, in accordance with conclusions from other studies, is most likely the outcome of the rising atmospheric temperature, which is due to other natural factors. This further supports the conclusion that global warming is not anthropogenically driven as an outcome of combustion.”


Error - Cookies Turned Off

“[T]he trend in the airborne fraction [ratio of CO2 accumulating in the atmosphere to the CO2 flux into the atmosphere due to human activity] since 1850 has been 0.7 ± 1.4% per decade, i.e. close to and not significantly different from zero. The analysis further shows that the statistical model of a constant airborne fraction agrees best with the available data if emissions from land use change are scaled down to 82% or less of their original estimates. Despite the predictions of coupled climate-carbon cycle models, no trend in the airborne fraction can be found.”

Like it or not, that last sentence means that there simply is not a discernible trend in the percentage of atmospheric CO2 that can be linked to our emissions...that is because in the grand scheme of things, the amount of CO2 that we produce is very small...not even enough to have any measurable effect on the year to year variation of the earth's own CO2 making processes...

Here is a paper from James Hansen himself...the father of global warming and the high priest of anthropogenic climate change...

Climate forcing growth rates: doubling down on our Faustian bargain - IOPscience

CLIP: “However, it is the dependence of the airborne fraction on fossil fuel emission rate that makes the post-2000 downturn of the airborne fraction particularly striking. The change of emission rate in 2000 from 1.5% yr-1 [1960-2000] to 3.1% yr-1 [2000-2011], other things being equal, would [should] have caused a sharp increase of the airborne fraction”

erl459410f3_online.jpg


Then he goes on to note that it has warmed since the little ice age, and makes a big assed assumption that the reason that it has warmed is CO2...and as evidence that it is CO2, he points to an 18th century thought experiment... The fact is that every ice core ever done shows us that increased atmospheric CO2 is the result of warming temperatures, not the cause...

Hell your guy even calls the output of computer models "empirical evidence" NEWSFLASH...it isn't.

Thanks for trying, but alas, there is nothing there but assumption after assumption after assumption being called empirical evidence...he does provide some actual instrumental data, but that is nothing more than evidence that he is easily fooled by instrumentation. It is in the section where he supposedly shows measurements of back radiation...energy moving from the cooler atmosphere down to the warmer surface of the earth where said radiation actually warms the surface... Ever look at the second law of thermodynamics? Here...take a look:


Second Law of Thermodynamics: It is not possible for heat to flow from a colder body to a warmer body without any work having been done to accomplish this flow. Energy will not flow spontaneously from a low temperature object to a higher temperature object.

Which part of that suggests that energy will move from the cooler atmosphere down to the warmer surface of the earth? He uses instruments that are cooled to a temperature of about -80F. He isn't measuring energy moving from the cooler atmosphere to the warmer surface of the earth...he is measuring energy moving from the warmer atmosphere to the cooler instrument....if you place an identical instrument with the cooling turned off right next to the cooled one, you will get no measurement of energy moving from the cooler atmosphere to the warmer instrument because according to the second law of thermodynamics (the mother of all physical laws) energy won't move spontaneously from a cool object to a warmer object....

It is always interesting to see what passes for evidence among those who believe...at least this one isn't an opinion piece from a newspaper as most provide....it is at least pseudoscience masquerading as science.....
Let's not continue. You can not make a claim about something and then continue about something else when you can't defend that claim.
You said that Venus is hot because of the pressure of its atmosphere and used gas giants to defend it. I pointed out that Jupiter's pressure to temperature is 0.0066 percent. Venus has a ratio of 64 percent.
That's what you read not what is implied.

So we had space stuff a hundred years ago or Mann's temperature reading tree rings?
The exert did not claim they had satellites a hundred years ago. It claimed it can and has measured the greenhouse effect using satellites. It's your typical strawman you are trying to use here.


?

Finnish study finds ‘practically no’ evidence for man-made climate change

A new study conducted by a Finnish research team has found little evidence to support the idea of man-made climate change. The results of the study were soon corroborated by researchers in Japan.
In a paper published late last month, entitled ‘No experimental evidence for the significant anthropogenic climate change’, a team of scientists at Turku University in Finland determined that current climate models fail to take into account the effects of cloud coverage on global temperatures, causing them to overestimate the impact of human-generated greenhouse gasses.

Models used by official bodies such as the Intergovernmental Panel on Climate Change (IPCC) “cannot compute correctly the natural component included in the observed global temperature,” the study said, adding that “a strong negative feedback of the clouds is missing” in the models.
The paper attributes rising temperature during 1985–2005 almost entirely to decreasing low cloud cover, from which it infers a very low sensitivity of climate to rising CO2.

  1. Given that we have data for global climate, CO2 (from Law Dome ice cores before 1958), and total solar irradiance reconstructions, all covering the 169 years 1850–2018, the period 1985–2005 is going to contain a lot of spurious high frequency “chatter” in the signals most of which can be “tuned out” by considering far more data. When one does so, the combined influence of the sun and CO2 over 169 years explain climate far more accurately than is possible using only 20 years of data, with or without cloud cover data.
  2. For the period 1985-2005 they consider three variables: rising temperature, decreasing cloud cover, and rising CO2. Noting the negative correlation between the first two, their hypothesis is that the first is almost completely explained by the second. They conclude that there is therefore no need to implicate CO2 as a causal factor: even though CO2 has risen 47% during the industrial era, they claim it has a negligible effect on climate because that rise in temperature can be almost entirely attributed to cloud cover.
This line of reasoning is patently illogical: with equal logic one could prove that cloud cover has no significant effect on climate by attributing it all to CO2. Furthermore it is based purely on correlations over a short period and not on any physical mechanism such as the greenhouse effect that can be expected to remain valid over far longer periods than a mere 20 years.
Vaughan Pratt, Since 1972 taught classes on many topics at MIT and Stanford
https://www.quora.com/Why-is-Turku-...-the-significant-anthropogenic-climate-change


Oh really?


Winter monsoons became stronger during geomagnetic reversal: Revealing the impact of cosmic rays on the Earth's climate


The Svensmark Effect is a hypothesis that galactic cosmic rays induce low cloud formation and influence the Earth's climate. Tests based on recent meteorological observation data only show minute changes in the amounts of galactic cosmic rays and cloud cover, making it hard to prove this theory. However, during the last geomagnetic reversal transition, when the amount of galactic cosmic rays increased dramatically, there was also a large increase in cloud cover, so it should be possible to detect the impact of cosmic rays on climate at a higher sensitivity.

In the Chinese Loess Plateau, just south of the Gobi Desert near the border of Mongolia, dust has been transported for 2.6 million years to form loess layers -- sediment created by the accumulation of wind-blown silt -- that can reach up to 200 meters in thickness. If the wind gets stronger, the coarse particles are carried further, and larger amounts are transported. Focusing on this phenomenon, the research team proposed that winter monsoons became stronger under the umbrella effect of increased cloud cover during the geomagnetic reversal. They investigated changes in particle size and accumulation speed of loess layer dust in two Loess Plateau locations.
What does any of this got to do with the link you provided? It's just another link that hypothesizes something they want to study but haven't. Nothing in it even tries to deny the greenhouse effect. Just searches for another possible explanation besides man.
 
What physical evidence supports the contention that carbon dioxide emissions from burning fossil fuels are the principal cause of global warming since 1970?

If you have it....lets see it. If you don't....then lets hear your best excuse for not providing it.
http://www.pas.va/content/dam/accademia/pdf/acta22/acta22-ramanathan.pdf
Here you go


OK...lets continue.

Regarding his "measurements" of the thickness of the "greenhouse blanket"...what crap. Any claim of heat "trapping" ability of additional CO2, and the resulting reduction of outgoing long wave radiation at the top of the atmosphere come with them an inherent necessity of an upper tropospheric hot spot. If energy is being trapped in the atmosphere, then that energy will have a fingerprint in the troposphere...trapped energy will produce a hot spot according to climate science. The fact is that there is no hot spot....


hot-spot-model-predicted.gif


And if the greenhouse gasses in the atmosphere were actually trapping energy, then the amount of energy leaving the earth at the top of the atmosphere would be reduced. It hasn't been. In fact, satellites have detected an increase in outgoing long wave radiation, and the increase has been going on for quite some time. Here, as measured by NOAA...


noaa-northern-hemisphere-olr-monthly-anomalies.png


Next, your author goes into an analysis of how much CO2 we have added to the atmosphere...Do keep in mind that so far, no actual evidence and not a single paper has been published in which the claimed warming due to our activities has been empirically measured, quantified, and blamed on greenhouse gasses....so any effort to show our contribution to CO2 gasses as evidence that we are causing warming is nothing more than evidence of increased CO2 with a big assed assumption that more CO2 causes warming tacked on.

But lets look at the CO2 increases and our influence on them. He simply makes an assumption that we are the cause of the increased CO2 in the atmosphere. The actual published science tells an entirely different story. The published science says that our contribution to the total atmospheric CO2 is so vanishingly small that it is essentially undetectable in the background noise...


Here are numerous peer reviewed, published studies which show very clearly that our effect on the total atmospheric CO2 is largely unmeasurable.. human beings, with all our CO2 producing capacity don't even make enough CO2 to overcome the year to year variation in the earth's own CO2 making machinery...

The fact is that the amount of CO2 we produce from year to year does not track with the amount of increase in atmospheric CO2.

https://www.researchgate.net/public...SPHERIC_CO2_TO_ANTHROPOGENIC_EMISSIONS_A_NOTE

CLIP: “A necessary condition for the theory of anthropogenic global warming is that there should be a close correlation between annual fluctuations of atmospheric CO2 and the annual rate of anthropogenic CO2 emissions. Data on atmospheric CO2 and anthropogenic emissions provided by the Mauna Loa measuring station and the CDIAC in the period 1959-2011 were studied using detrended correlation analysis to determine whether, net of their common long term upward trends, the rate of change in atmospheric CO2 is responsive to the rate of anthropogenic emissions in a shorter time scale from year to year. … [R]esults do not indicate a measurable year to year effect of annual anthropogenic emissions on the annual rate of CO2 accumulation in the atmosphere.”


CO2-Emissions-vs-CO2-ppm-concentration.jpg


If you look at the graph...assuming that you can read a graph...you will see for example, that there was a rise in our emissions between 2007 and 2008 but a significant decline in the atmospheric CO2 concentration. Do you believe that human CO2 went somewhere to hide and waited around for some years before it decided to have an effect on the total atmospheric CO2 concentration? Then between 2008 and 2009, there was a decline in the amount of CO2 that humans emitted into the atmosphere, but a significant rise in the atmospheric CO2 concentration. Then from 2010 to 2014 there was a large rise in man made CO2 emissions but an overall flat to declining trend in the atmospheric CO2 concentration. Between 2014 to 2016 there was a slight decline in man made CO2 emissions, but a pronounced rise in the atmospheric CO2 concentrations. Like I said, we produce just a fraction of the natural variation in the earth's own CO2 making machinery from year to year and we are learning that we really don't even have a handle on how much CO2 the earth is producing...the undersea volcanoes are a prime example of how much we don't know.


https://www2.meteo.uni-bonn.de/bibliothek/Flohn_Publikationen/K287-K320_1981-1985/K299.pdf

CLIP: The recent increase of the CO2-content of air varies distinctly from year to year, rather independent from the irregular annual increase of global CO2-production from fossil fuel and cement, which has since 1973 decreased from about 4.5 percent to 2.25 percent per year (Rotty 1981).”

Comparative investigations (Keeling and Bacastow 1977, Newll et al. 1978, Angell 1981) found a positive correlation between the rate of increase of atmospheric CO2 and the fluctuations of sea surface temperature (SST) in the equatorial Pacific, which are caused by rather abrupt changes between upwelling cool water and downwelling warm water (“El Niño”) in the eastern equatorial Pacific. Indeed the cool upwelling water is not only rich in (anorganic) CO2 but also in nutrients and organisms. (algae) which consume much atmospheric CO2 in organic form, thus reducing the increase in atmospehreic CO2. Conversely the warm water of tropical oceans, with SST near 27°C, is barren, thus leading to a reduction of CO2 uptake by the ocean and greater increase of the CO2. … A crude estimate of these differences is demonstrated by the fact that during the period 1958-1974, the average CO2-increase within five selective years with prevailing cool water only 0.57 ppm/a [per year], while during five years with prevailing warm water it was 1.11 ppm/a. Thus in a a warm water year, more than one Gt (1015 g) carbon is additionally injected into the atmosphere, in comparison to a cold water year.”


Practically every actual study ever done tells us that increases in CO2 follow increases in temperature...that means that increased CO2 is the result of increased temperature, not the cause of increased temperature...which makes sense since warm oceans hold less CO2 and as they warm, they outages CO2.

https://www.researchgate.net/public...spheric_carbon_dioxide_and_global_temperature

Temperature-Change-Leads-CO2-Growth-Change.jpg


CLIP"
“There exist a clear phase relationship between changes of atmospheric CO2 and the different global temperature records, whether representing sea surface temperature, surface air temperature, or lower troposphere temperature, with changes in the amount of atmospheric CO2 always lagging behind corresponding changes in temperature.”

(1) The overall global temperature change sequence of events appears to be from 1) the ocean surface to 2) the land surface to 3) the lower troposphere.

(2) Changes in global atmospheric CO2 are lagging about 11–12 months behind changes in global sea surface temperature.

(3) Changes in global atmospheric CO2 are lagging 9.5–10 months behind changes in global air surface temperature.

(4) Changes in global atmospheric CO2 are lagging about 9 months behind changes in global lower troposphere temperature.

(5) Changes in ocean temperatures appear to explain a substantial part of the observed changes in atmospheric CO2 since January 1980.

(6) CO2 released from anthropogenic sources apparently has little influence on the observed changes in atmospheric CO2, and changes in atmospheric CO2 are not tracking changes in human emissions.

(7) On the time scale investigated, the overriding effect of large volcanic eruptions appears to be a reduction of atmospheric CO2, presumably due to the dominance of associated cooling effects from clouds associated with volcanic gases/aerosols and volcanic debris.

(8) Since at least 1980 changes in global temperature, and presumably especially southern ocean temperature, appear to represent a major control on changes in atmospheric CO2.

Temperature-Change-Leads-CO2-Growth-Change-Humulum-2013.jpg


SAGE Journals: Your gateway to world-class research journals

CLIP: “[T]he warming and cooling of the ocean waters control how much CO2 is exchanged with atmosphere and thereby controlling the concentration of atmospheric CO2. It is obvious that when the oceans are cooled, in this case due to volcanic eruptions or La Niña events, they release less CO2 and when it was an extremely warm year, due to an El Niño, the oceans release more CO2. [D]uring the measured time 1979 to 2006 there has been a continued natural increase in temperature causing a continued increase of CO2 released into the atmosphere. This implies that temperature variations caused by El Niños, La Niñas, volcanic eruptions, varying cloud formations and ultimately the varying solar irradiation control the amount of CO2 which is leaving or being absorbed by the oceans.”


https://pubs.acs.org/doi/abs/10.1021/ef800581r

CLIP: “[With the short (5−15 year) RT [residence time] results shown to be in quasi-equilibrium, this then supports the (independently based) conclusion that the long-term (∼100 year) rising atmospheric CO2 concentration is not from anthropogenic sources but, in accordance with conclusions from other studies, is most likely the outcome of the rising atmospheric temperature, which is due to other natural factors. This further supports the conclusion that global warming is not anthropogenically driven as an outcome of combustion.”


Error - Cookies Turned Off

“[T]he trend in the airborne fraction [ratio of CO2 accumulating in the atmosphere to the CO2 flux into the atmosphere due to human activity] since 1850 has been 0.7 ± 1.4% per decade, i.e. close to and not significantly different from zero. The analysis further shows that the statistical model of a constant airborne fraction agrees best with the available data if emissions from land use change are scaled down to 82% or less of their original estimates. Despite the predictions of coupled climate-carbon cycle models, no trend in the airborne fraction can be found.”

Like it or not, that last sentence means that there simply is not a discernible trend in the percentage of atmospheric CO2 that can be linked to our emissions...that is because in the grand scheme of things, the amount of CO2 that we produce is very small...not even enough to have any measurable effect on the year to year variation of the earth's own CO2 making processes...

Here is a paper from James Hansen himself...the father of global warming and the high priest of anthropogenic climate change...

Climate forcing growth rates: doubling down on our Faustian bargain - IOPscience

CLIP: “However, it is the dependence of the airborne fraction on fossil fuel emission rate that makes the post-2000 downturn of the airborne fraction particularly striking. The change of emission rate in 2000 from 1.5% yr-1 [1960-2000] to 3.1% yr-1 [2000-2011], other things being equal, would [should] have caused a sharp increase of the airborne fraction”

erl459410f3_online.jpg


Then he goes on to note that it has warmed since the little ice age, and makes a big assed assumption that the reason that it has warmed is CO2...and as evidence that it is CO2, he points to an 18th century thought experiment... The fact is that every ice core ever done shows us that increased atmospheric CO2 is the result of warming temperatures, not the cause...

Hell your guy even calls the output of computer models "empirical evidence" NEWSFLASH...it isn't.

Thanks for trying, but alas, there is nothing there but assumption after assumption after assumption being called empirical evidence...he does provide some actual instrumental data, but that is nothing more than evidence that he is easily fooled by instrumentation. It is in the section where he supposedly shows measurements of back radiation...energy moving from the cooler atmosphere down to the warmer surface of the earth where said radiation actually warms the surface... Ever look at the second law of thermodynamics? Here...take a look:


Second Law of Thermodynamics: It is not possible for heat to flow from a colder body to a warmer body without any work having been done to accomplish this flow. Energy will not flow spontaneously from a low temperature object to a higher temperature object.

Which part of that suggests that energy will move from the cooler atmosphere down to the warmer surface of the earth? He uses instruments that are cooled to a temperature of about -80F. He isn't measuring energy moving from the cooler atmosphere to the warmer surface of the earth...he is measuring energy moving from the warmer atmosphere to the cooler instrument....if you place an identical instrument with the cooling turned off right next to the cooled one, you will get no measurement of energy moving from the cooler atmosphere to the warmer instrument because according to the second law of thermodynamics (the mother of all physical laws) energy won't move spontaneously from a cool object to a warmer object....

It is always interesting to see what passes for evidence among those who believe...at least this one isn't an opinion piece from a newspaper as most provide....it is at least pseudoscience masquerading as science.....
Let's not continue. You can not make a claim about something and then continue about something else when you can't defend that claim.
You said that Venus is hot because of the pressure of its atmosphere and used gas giants to defend it. I pointed out that Jupiter's pressure to temperature is 0.0066 percent. Venus has a ratio of 64 percent.
So we had space stuff a hundred years ago or Mann's temperature reading tree rings?
The exert did not claim they had satellites a hundred years ago. It claimed it can and has measured the greenhouse effect using satellites. It's your typical strawman you are trying to use here.


?

Finnish study finds ‘practically no’ evidence for man-made climate change

A new study conducted by a Finnish research team has found little evidence to support the idea of man-made climate change. The results of the study were soon corroborated by researchers in Japan.
In a paper published late last month, entitled ‘No experimental evidence for the significant anthropogenic climate change’, a team of scientists at Turku University in Finland determined that current climate models fail to take into account the effects of cloud coverage on global temperatures, causing them to overestimate the impact of human-generated greenhouse gasses.

Models used by official bodies such as the Intergovernmental Panel on Climate Change (IPCC) “cannot compute correctly the natural component included in the observed global temperature,” the study said, adding that “a strong negative feedback of the clouds is missing” in the models.
The paper attributes rising temperature during 1985–2005 almost entirely to decreasing low cloud cover, from which it infers a very low sensitivity of climate to rising CO2.

  1. Given that we have data for global climate, CO2 (from Law Dome ice cores before 1958), and total solar irradiance reconstructions, all covering the 169 years 1850–2018, the period 1985–2005 is going to contain a lot of spurious high frequency “chatter” in the signals most of which can be “tuned out” by considering far more data. When one does so, the combined influence of the sun and CO2 over 169 years explain climate far more accurately than is possible using only 20 years of data, with or without cloud cover data.
  2. For the period 1985-2005 they consider three variables: rising temperature, decreasing cloud cover, and rising CO2. Noting the negative correlation between the first two, their hypothesis is that the first is almost completely explained by the second. They conclude that there is therefore no need to implicate CO2 as a causal factor: even though CO2 has risen 47% during the industrial era, they claim it has a negligible effect on climate because that rise in temperature can be almost entirely attributed to cloud cover.
This line of reasoning is patently illogical: with equal logic one could prove that cloud cover has no significant effect on climate by attributing it all to CO2. Furthermore it is based purely on correlations over a short period and not on any physical mechanism such as the greenhouse effect that can be expected to remain valid over far longer periods than a mere 20 years.
Vaughan Pratt, Since 1972 taught classes on many topics at MIT and Stanford
https://www.quora.com/Why-is-Turku-...-the-significant-anthropogenic-climate-change


Oh really?


Winter monsoons became stronger during geomagnetic reversal: Revealing the impact of cosmic rays on the Earth's climate


The Svensmark Effect is a hypothesis that galactic cosmic rays induce low cloud formation and influence the Earth's climate. Tests based on recent meteorological observation data only show minute changes in the amounts of galactic cosmic rays and cloud cover, making it hard to prove this theory. However, during the last geomagnetic reversal transition, when the amount of galactic cosmic rays increased dramatically, there was also a large increase in cloud cover, so it should be possible to detect the impact of cosmic rays on climate at a higher sensitivity.

In the Chinese Loess Plateau, just south of the Gobi Desert near the border of Mongolia, dust has been transported for 2.6 million years to form loess layers -- sediment created by the accumulation of wind-blown silt -- that can reach up to 200 meters in thickness. If the wind gets stronger, the coarse particles are carried further, and larger amounts are transported. Focusing on this phenomenon, the research team proposed that winter monsoons became stronger under the umbrella effect of increased cloud cover during the geomagnetic reversal. They investigated changes in particle size and accumulation speed of loess layer dust in two Loess Plateau locations.
What does any of this got to do with the link you provided? It's just another link that hypothesizes something they want to study but haven't. Nothing in it even tries to deny the greenhouse effect. Just searches for another possible explanation besides man.


Wait a second the earth has been changing for 4.5 billion years , man has been driving cars for a 100 years?
 
The fact that alarmist scientists fail to mention is that prior to the onset of the present ice age, practically every creature in the oceans had already evolved to its present form...at that time, the atmospheric CO2 was in the range of 1000ppm...

They had evolved to a form that tolerated the level of ocean acidity that existed at that time. And they will again.

Your argument is totally irrelevant to the simple fact that as atmospheric CO2 increases due to burning of fossil fuels, more CO2 is absorbed by the oceans and they become more acidic. It's damaging the corals, but they will adapt and survive, or other forms will evolve.
 
Sure, it does. That's why it's over 800 degrees Fahrenheit, while it's distance to the sun would make it at most 163 degrees Fahrenheit, without the greenhouse effect. I tell you what. Use CO2. Compress it to 1384 Psi and see if you can get it to 700 degrees Fahrenheit. Wich is the difference more or less between Venus temperature with or without the greenhouse effect. I know for a fact that CO2 is compressed in industry to a much higher pressure than 1348 Psi the temperature it generates doesn't even come close to 700 degrees Fahrenheit.

Once a dupe.....always a dupe apparently. Imagine...thinking a planet is a closed system...venus the energy escaping the top of the atmosphere in venus is the same as the energy it receives from the sun...We know that no energy is being "trapped" by the CO2 because the amount of energy going out is the same as the energy going in...that leaves nothing but the idea that CO2 is creating all that additional energy by itself...

What is that physical law about not being able to create or destroy energy?

Sorry guy...whoever it is that is giving you your opinion has done you a gross disservice...
Link the study that shows an equal amount of energy escaping Venus as it receives. Be my guest. You, by the way, have simply dodged my question. Show me a graph that shows that when you compress co2 to 1384 Psi you get an increase in temperature of 700 degrees F

Don't hold your breath waiting on that.


OK...lets continue.

Regarding his "measurements" of the thickness of the "greenhouse blanket"...what crap. Any claim of heat "trapping" ability of additional CO2, and the resulting reduction of outgoing long wave radiation at the top of the atmosphere come with them an inherent necessity of an upper tropospheric hot spot. If energy is being trapped in the atmosphere, then that energy will have a fingerprint in the troposphere...trapped energy will produce a hot spot according to climate science. The fact is that there is no hot spot....


hot-spot-model-predicted.gif


And if the greenhouse gasses in the atmosphere were actually trapping energy, then the amount of energy leaving the earth at the top of the atmosphere would be reduced. It hasn't been. In fact, satellites have detected an increase in outgoing long wave radiation, and the increase has been going on for quite some time. Here, as measured by NOAA...


noaa-northern-hemisphere-olr-monthly-anomalies.png


Next, your author goes into an analysis of how much CO2 we have added to the atmosphere...Do keep in mind that so far, no actual evidence and not a single paper has been published in which the claimed warming due to our activities has been empirically measured, quantified, and blamed on greenhouse gasses....so any effort to show our contribution to CO2 gasses as evidence that we are causing warming is nothing more than evidence of increased CO2 with a big assed assumption that more CO2 causes warming tacked on.

But lets look at the CO2 increases and our influence on them. He simply makes an assumption that we are the cause of the increased CO2 in the atmosphere. The actual published science tells an entirely different story. The published science says that our contribution to the total atmospheric CO2 is so vanishingly small that it is essentially undetectable in the background noise...


Here are numerous peer reviewed, published studies which show very clearly that our effect on the total atmospheric CO2 is largely unmeasurable.. human beings, with all our CO2 producing capacity don't even make enough CO2 to overcome the year to year variation in the earth's own CO2 making machinery...

The fact is that the amount of CO2 we produce from year to year does not track with the amount of increase in atmospheric CO2.

https://www.researchgate.net/public...SPHERIC_CO2_TO_ANTHROPOGENIC_EMISSIONS_A_NOTE

CLIP: “A necessary condition for the theory of anthropogenic global warming is that there should be a close correlation between annual fluctuations of atmospheric CO2 and the annual rate of anthropogenic CO2 emissions. Data on atmospheric CO2 and anthropogenic emissions provided by the Mauna Loa measuring station and the CDIAC in the period 1959-2011 were studied using detrended correlation analysis to determine whether, net of their common long term upward trends, the rate of change in atmospheric CO2 is responsive to the rate of anthropogenic emissions in a shorter time scale from year to year. … [R]esults do not indicate a measurable year to year effect of annual anthropogenic emissions on the annual rate of CO2 accumulation in the atmosphere.”


CO2-Emissions-vs-CO2-ppm-concentration.jpg


If you look at the graph...assuming that you can read a graph...you will see for example, that there was a rise in our emissions between 2007 and 2008 but a significant decline in the atmospheric CO2 concentration. Do you believe that human CO2 went somewhere to hide and waited around for some years before it decided to have an effect on the total atmospheric CO2 concentration? Then between 2008 and 2009, there was a decline in the amount of CO2 that humans emitted into the atmosphere, but a significant rise in the atmospheric CO2 concentration. Then from 2010 to 2014 there was a large rise in man made CO2 emissions but an overall flat to declining trend in the atmospheric CO2 concentration. Between 2014 to 2016 there was a slight decline in man made CO2 emissions, but a pronounced rise in the atmospheric CO2 concentrations. Like I said, we produce just a fraction of the natural variation in the earth's own CO2 making machinery from year to year and we are learning that we really don't even have a handle on how much CO2 the earth is producing...the undersea volcanoes are a prime example of how much we don't know.


https://www2.meteo.uni-bonn.de/bibliothek/Flohn_Publikationen/K287-K320_1981-1985/K299.pdf

CLIP: The recent increase of the CO2-content of air varies distinctly from year to year, rather independent from the irregular annual increase of global CO2-production from fossil fuel and cement, which has since 1973 decreased from about 4.5 percent to 2.25 percent per year (Rotty 1981).”

Comparative investigations (Keeling and Bacastow 1977, Newll et al. 1978, Angell 1981) found a positive correlation between the rate of increase of atmospheric CO2 and the fluctuations of sea surface temperature (SST) in the equatorial Pacific, which are caused by rather abrupt changes between upwelling cool water and downwelling warm water (“El Niño”) in the eastern equatorial Pacific. Indeed the cool upwelling water is not only rich in (anorganic) CO2 but also in nutrients and organisms. (algae) which consume much atmospheric CO2 in organic form, thus reducing the increase in atmospehreic CO2. Conversely the warm water of tropical oceans, with SST near 27°C, is barren, thus leading to a reduction of CO2 uptake by the ocean and greater increase of the CO2. … A crude estimate of these differences is demonstrated by the fact that during the period 1958-1974, the average CO2-increase within five selective years with prevailing cool water only 0.57 ppm/a [per year], while during five years with prevailing warm water it was 1.11 ppm/a. Thus in a a warm water year, more than one Gt (1015 g) carbon is additionally injected into the atmosphere, in comparison to a cold water year.”


Practically every actual study ever done tells us that increases in CO2 follow increases in temperature...that means that increased CO2 is the result of increased temperature, not the cause of increased temperature...which makes sense since warm oceans hold less CO2 and as they warm, they outages CO2.

https://www.researchgate.net/public...spheric_carbon_dioxide_and_global_temperature

Temperature-Change-Leads-CO2-Growth-Change.jpg


CLIP"
“There exist a clear phase relationship between changes of atmospheric CO2 and the different global temperature records, whether representing sea surface temperature, surface air temperature, or lower troposphere temperature, with changes in the amount of atmospheric CO2 always lagging behind corresponding changes in temperature.”

(1) The overall global temperature change sequence of events appears to be from 1) the ocean surface to 2) the land surface to 3) the lower troposphere.

(2) Changes in global atmospheric CO2 are lagging about 11–12 months behind changes in global sea surface temperature.

(3) Changes in global atmospheric CO2 are lagging 9.5–10 months behind changes in global air surface temperature.

(4) Changes in global atmospheric CO2 are lagging about 9 months behind changes in global lower troposphere temperature.

(5) Changes in ocean temperatures appear to explain a substantial part of the observed changes in atmospheric CO2 since January 1980.

(6) CO2 released from anthropogenic sources apparently has little influence on the observed changes in atmospheric CO2, and changes in atmospheric CO2 are not tracking changes in human emissions.

(7) On the time scale investigated, the overriding effect of large volcanic eruptions appears to be a reduction of atmospheric CO2, presumably due to the dominance of associated cooling effects from clouds associated with volcanic gases/aerosols and volcanic debris.

(8) Since at least 1980 changes in global temperature, and presumably especially southern ocean temperature, appear to represent a major control on changes in atmospheric CO2.

Temperature-Change-Leads-CO2-Growth-Change-Humulum-2013.jpg


SAGE Journals: Your gateway to world-class research journals

CLIP: “[T]he warming and cooling of the ocean waters control how much CO2 is exchanged with atmosphere and thereby controlling the concentration of atmospheric CO2. It is obvious that when the oceans are cooled, in this case due to volcanic eruptions or La Niña events, they release less CO2 and when it was an extremely warm year, due to an El Niño, the oceans release more CO2. [D]uring the measured time 1979 to 2006 there has been a continued natural increase in temperature causing a continued increase of CO2 released into the atmosphere. This implies that temperature variations caused by El Niños, La Niñas, volcanic eruptions, varying cloud formations and ultimately the varying solar irradiation control the amount of CO2 which is leaving or being absorbed by the oceans.”


https://pubs.acs.org/doi/abs/10.1021/ef800581r

CLIP: “[With the short (5−15 year) RT [residence time] results shown to be in quasi-equilibrium, this then supports the (independently based) conclusion that the long-term (∼100 year) rising atmospheric CO2 concentration is not from anthropogenic sources but, in accordance with conclusions from other studies, is most likely the outcome of the rising atmospheric temperature, which is due to other natural factors. This further supports the conclusion that global warming is not anthropogenically driven as an outcome of combustion.”


Error - Cookies Turned Off

“[T]he trend in the airborne fraction [ratio of CO2 accumulating in the atmosphere to the CO2 flux into the atmosphere due to human activity] since 1850 has been 0.7 ± 1.4% per decade, i.e. close to and not significantly different from zero. The analysis further shows that the statistical model of a constant airborne fraction agrees best with the available data if emissions from land use change are scaled down to 82% or less of their original estimates. Despite the predictions of coupled climate-carbon cycle models, no trend in the airborne fraction can be found.”

Like it or not, that last sentence means that there simply is not a discernible trend in the percentage of atmospheric CO2 that can be linked to our emissions...that is because in the grand scheme of things, the amount of CO2 that we produce is very small...not even enough to have any measurable effect on the year to year variation of the earth's own CO2 making processes...

Here is a paper from James Hansen himself...the father of global warming and the high priest of anthropogenic climate change...

Climate forcing growth rates: doubling down on our Faustian bargain - IOPscience

CLIP: “However, it is the dependence of the airborne fraction on fossil fuel emission rate that makes the post-2000 downturn of the airborne fraction particularly striking. The change of emission rate in 2000 from 1.5% yr-1 [1960-2000] to 3.1% yr-1 [2000-2011], other things being equal, would [should] have caused a sharp increase of the airborne fraction”

erl459410f3_online.jpg


Then he goes on to note that it has warmed since the little ice age, and makes a big assed assumption that the reason that it has warmed is CO2...and as evidence that it is CO2, he points to an 18th century thought experiment... The fact is that every ice core ever done shows us that increased atmospheric CO2 is the result of warming temperatures, not the cause...

Hell your guy even calls the output of computer models "empirical evidence" NEWSFLASH...it isn't.

Thanks for trying, but alas, there is nothing there but assumption after assumption after assumption being called empirical evidence...he does provide some actual instrumental data, but that is nothing more than evidence that he is easily fooled by instrumentation. It is in the section where he supposedly shows measurements of back radiation...energy moving from the cooler atmosphere down to the warmer surface of the earth where said radiation actually warms the surface... Ever look at the second law of thermodynamics? Here...take a look:


Second Law of Thermodynamics: It is not possible for heat to flow from a colder body to a warmer body without any work having been done to accomplish this flow. Energy will not flow spontaneously from a low temperature object to a higher temperature object.

Which part of that suggests that energy will move from the cooler atmosphere down to the warmer surface of the earth? He uses instruments that are cooled to a temperature of about -80F. He isn't measuring energy moving from the cooler atmosphere to the warmer surface of the earth...he is measuring energy moving from the warmer atmosphere to the cooler instrument....if you place an identical instrument with the cooling turned off right next to the cooled one, you will get no measurement of energy moving from the cooler atmosphere to the warmer instrument because according to the second law of thermodynamics (the mother of all physical laws) energy won't move spontaneously from a cool object to a warmer object....

It is always interesting to see what passes for evidence among those who believe...at least this one isn't an opinion piece from a newspaper as most provide....it is at least pseudoscience masquerading as science.....
Let's not continue. You can not make a claim about something and then continue about something else when you can't defend that claim.
You said that Venus is hot because of the pressure of its atmosphere and used gas giants to defend it. I pointed out that Jupiter's pressure to temperature is 0.0066 percent. Venus has a ratio of 64 percent.
The exert did not claim they had satellites a hundred years ago. It claimed it can and has measured the greenhouse effect using satellites. It's your typical strawman you are trying to use here.


?

Finnish study finds ‘practically no’ evidence for man-made climate change

A new study conducted by a Finnish research team has found little evidence to support the idea of man-made climate change. The results of the study were soon corroborated by researchers in Japan.
In a paper published late last month, entitled ‘No experimental evidence for the significant anthropogenic climate change’, a team of scientists at Turku University in Finland determined that current climate models fail to take into account the effects of cloud coverage on global temperatures, causing them to overestimate the impact of human-generated greenhouse gasses.

Models used by official bodies such as the Intergovernmental Panel on Climate Change (IPCC) “cannot compute correctly the natural component included in the observed global temperature,” the study said, adding that “a strong negative feedback of the clouds is missing” in the models.
The paper attributes rising temperature during 1985–2005 almost entirely to decreasing low cloud cover, from which it infers a very low sensitivity of climate to rising CO2.

  1. Given that we have data for global climate, CO2 (from Law Dome ice cores before 1958), and total solar irradiance reconstructions, all covering the 169 years 1850–2018, the period 1985–2005 is going to contain a lot of spurious high frequency “chatter” in the signals most of which can be “tuned out” by considering far more data. When one does so, the combined influence of the sun and CO2 over 169 years explain climate far more accurately than is possible using only 20 years of data, with or without cloud cover data.
  2. For the period 1985-2005 they consider three variables: rising temperature, decreasing cloud cover, and rising CO2. Noting the negative correlation between the first two, their hypothesis is that the first is almost completely explained by the second. They conclude that there is therefore no need to implicate CO2 as a causal factor: even though CO2 has risen 47% during the industrial era, they claim it has a negligible effect on climate because that rise in temperature can be almost entirely attributed to cloud cover.
This line of reasoning is patently illogical: with equal logic one could prove that cloud cover has no significant effect on climate by attributing it all to CO2. Furthermore it is based purely on correlations over a short period and not on any physical mechanism such as the greenhouse effect that can be expected to remain valid over far longer periods than a mere 20 years.
Vaughan Pratt, Since 1972 taught classes on many topics at MIT and Stanford
https://www.quora.com/Why-is-Turku-...-the-significant-anthropogenic-climate-change


Oh really?


Winter monsoons became stronger during geomagnetic reversal: Revealing the impact of cosmic rays on the Earth's climate


The Svensmark Effect is a hypothesis that galactic cosmic rays induce low cloud formation and influence the Earth's climate. Tests based on recent meteorological observation data only show minute changes in the amounts of galactic cosmic rays and cloud cover, making it hard to prove this theory. However, during the last geomagnetic reversal transition, when the amount of galactic cosmic rays increased dramatically, there was also a large increase in cloud cover, so it should be possible to detect the impact of cosmic rays on climate at a higher sensitivity.

In the Chinese Loess Plateau, just south of the Gobi Desert near the border of Mongolia, dust has been transported for 2.6 million years to form loess layers -- sediment created by the accumulation of wind-blown silt -- that can reach up to 200 meters in thickness. If the wind gets stronger, the coarse particles are carried further, and larger amounts are transported. Focusing on this phenomenon, the research team proposed that winter monsoons became stronger under the umbrella effect of increased cloud cover during the geomagnetic reversal. They investigated changes in particle size and accumulation speed of loess layer dust in two Loess Plateau locations.
What does any of this got to do with the link you provided? It's just another link that hypothesizes something they want to study but haven't. Nothing in it even tries to deny the greenhouse effect. Just searches for another possible explanation besides man.


Wait a second the earth has been changing for 4.5 billion years , man has been driving cars for a 100 years?
Sure and earth has been both hotter and colder. I have little doubt that mankind will survive AGW. What I am less sure of is if mankind will survive AGW without severely crippling the ecosystem. That it will survive without having to take drastic measures to safeguard its cities. That it will survive without wars breaking out as resources like drinkable water get harder to come by. We are a very adaptable species and will survive, after all, we have survived worse. Surviving is not the same as thriving tough.
 
Sure, it does. That's why it's over 800 degrees Fahrenheit, while it's distance to the sun would make it at most 163 degrees Fahrenheit, without the greenhouse effect. I tell you what. Use CO2. Compress it to 1384 Psi and see if you can get it to 700 degrees Fahrenheit. Wich is the difference more or less between Venus temperature with or without the greenhouse effect. I know for a fact that CO2 is compressed in industry to a much higher pressure than 1348 Psi the temperature it generates doesn't even come close to 700 degrees Fahrenheit.

Once a dupe.....always a dupe apparently. Imagine...thinking a planet is a closed system...venus the energy escaping the top of the atmosphere in venus is the same as the energy it receives from the sun...We know that no energy is being "trapped" by the CO2 because the amount of energy going out is the same as the energy going in...that leaves nothing but the idea that CO2 is creating all that additional energy by itself...

What is that physical law about not being able to create or destroy energy?

Sorry guy...whoever it is that is giving you your opinion has done you a gross disservice...
Link the study that shows an equal amount of energy escaping Venus as it receives. Be my guest. You, by the way, have simply dodged my question. Show me a graph that shows that when you compress co2 to 1384 Psi you get an increase in temperature of 700 degrees F

Don't hold your breath waiting on that.
Good thing you told me. I was turning blue. :icon_lol:
 
OK...lets continue.

Regarding his "measurements" of the thickness of the "greenhouse blanket"...what crap. Any claim of heat "trapping" ability of additional CO2, and the resulting reduction of outgoing long wave radiation at the top of the atmosphere come with them an inherent necessity of an upper tropospheric hot spot. If energy is being trapped in the atmosphere, then that energy will have a fingerprint in the troposphere...trapped energy will produce a hot spot according to climate science. The fact is that there is no hot spot....


hot-spot-model-predicted.gif


And if the greenhouse gasses in the atmosphere were actually trapping energy, then the amount of energy leaving the earth at the top of the atmosphere would be reduced. It hasn't been. In fact, satellites have detected an increase in outgoing long wave radiation, and the increase has been going on for quite some time. Here, as measured by NOAA...


noaa-northern-hemisphere-olr-monthly-anomalies.png


Next, your author goes into an analysis of how much CO2 we have added to the atmosphere...Do keep in mind that so far, no actual evidence and not a single paper has been published in which the claimed warming due to our activities has been empirically measured, quantified, and blamed on greenhouse gasses....so any effort to show our contribution to CO2 gasses as evidence that we are causing warming is nothing more than evidence of increased CO2 with a big assed assumption that more CO2 causes warming tacked on.

But lets look at the CO2 increases and our influence on them. He simply makes an assumption that we are the cause of the increased CO2 in the atmosphere. The actual published science tells an entirely different story. The published science says that our contribution to the total atmospheric CO2 is so vanishingly small that it is essentially undetectable in the background noise...


Here are numerous peer reviewed, published studies which show very clearly that our effect on the total atmospheric CO2 is largely unmeasurable.. human beings, with all our CO2 producing capacity don't even make enough CO2 to overcome the year to year variation in the earth's own CO2 making machinery...

The fact is that the amount of CO2 we produce from year to year does not track with the amount of increase in atmospheric CO2.

https://www.researchgate.net/public...SPHERIC_CO2_TO_ANTHROPOGENIC_EMISSIONS_A_NOTE

CLIP: “A necessary condition for the theory of anthropogenic global warming is that there should be a close correlation between annual fluctuations of atmospheric CO2 and the annual rate of anthropogenic CO2 emissions. Data on atmospheric CO2 and anthropogenic emissions provided by the Mauna Loa measuring station and the CDIAC in the period 1959-2011 were studied using detrended correlation analysis to determine whether, net of their common long term upward trends, the rate of change in atmospheric CO2 is responsive to the rate of anthropogenic emissions in a shorter time scale from year to year. … [R]esults do not indicate a measurable year to year effect of annual anthropogenic emissions on the annual rate of CO2 accumulation in the atmosphere.”


CO2-Emissions-vs-CO2-ppm-concentration.jpg


If you look at the graph...assuming that you can read a graph...you will see for example, that there was a rise in our emissions between 2007 and 2008 but a significant decline in the atmospheric CO2 concentration. Do you believe that human CO2 went somewhere to hide and waited around for some years before it decided to have an effect on the total atmospheric CO2 concentration? Then between 2008 and 2009, there was a decline in the amount of CO2 that humans emitted into the atmosphere, but a significant rise in the atmospheric CO2 concentration. Then from 2010 to 2014 there was a large rise in man made CO2 emissions but an overall flat to declining trend in the atmospheric CO2 concentration. Between 2014 to 2016 there was a slight decline in man made CO2 emissions, but a pronounced rise in the atmospheric CO2 concentrations. Like I said, we produce just a fraction of the natural variation in the earth's own CO2 making machinery from year to year and we are learning that we really don't even have a handle on how much CO2 the earth is producing...the undersea volcanoes are a prime example of how much we don't know.


https://www2.meteo.uni-bonn.de/bibliothek/Flohn_Publikationen/K287-K320_1981-1985/K299.pdf

CLIP: The recent increase of the CO2-content of air varies distinctly from year to year, rather independent from the irregular annual increase of global CO2-production from fossil fuel and cement, which has since 1973 decreased from about 4.5 percent to 2.25 percent per year (Rotty 1981).”

Comparative investigations (Keeling and Bacastow 1977, Newll et al. 1978, Angell 1981) found a positive correlation between the rate of increase of atmospheric CO2 and the fluctuations of sea surface temperature (SST) in the equatorial Pacific, which are caused by rather abrupt changes between upwelling cool water and downwelling warm water (“El Niño”) in the eastern equatorial Pacific. Indeed the cool upwelling water is not only rich in (anorganic) CO2 but also in nutrients and organisms. (algae) which consume much atmospheric CO2 in organic form, thus reducing the increase in atmospehreic CO2. Conversely the warm water of tropical oceans, with SST near 27°C, is barren, thus leading to a reduction of CO2 uptake by the ocean and greater increase of the CO2. … A crude estimate of these differences is demonstrated by the fact that during the period 1958-1974, the average CO2-increase within five selective years with prevailing cool water only 0.57 ppm/a [per year], while during five years with prevailing warm water it was 1.11 ppm/a. Thus in a a warm water year, more than one Gt (1015 g) carbon is additionally injected into the atmosphere, in comparison to a cold water year.”


Practically every actual study ever done tells us that increases in CO2 follow increases in temperature...that means that increased CO2 is the result of increased temperature, not the cause of increased temperature...which makes sense since warm oceans hold less CO2 and as they warm, they outages CO2.

https://www.researchgate.net/public...spheric_carbon_dioxide_and_global_temperature

Temperature-Change-Leads-CO2-Growth-Change.jpg


CLIP"
“There exist a clear phase relationship between changes of atmospheric CO2 and the different global temperature records, whether representing sea surface temperature, surface air temperature, or lower troposphere temperature, with changes in the amount of atmospheric CO2 always lagging behind corresponding changes in temperature.”

(1) The overall global temperature change sequence of events appears to be from 1) the ocean surface to 2) the land surface to 3) the lower troposphere.

(2) Changes in global atmospheric CO2 are lagging about 11–12 months behind changes in global sea surface temperature.

(3) Changes in global atmospheric CO2 are lagging 9.5–10 months behind changes in global air surface temperature.

(4) Changes in global atmospheric CO2 are lagging about 9 months behind changes in global lower troposphere temperature.

(5) Changes in ocean temperatures appear to explain a substantial part of the observed changes in atmospheric CO2 since January 1980.

(6) CO2 released from anthropogenic sources apparently has little influence on the observed changes in atmospheric CO2, and changes in atmospheric CO2 are not tracking changes in human emissions.

(7) On the time scale investigated, the overriding effect of large volcanic eruptions appears to be a reduction of atmospheric CO2, presumably due to the dominance of associated cooling effects from clouds associated with volcanic gases/aerosols and volcanic debris.

(8) Since at least 1980 changes in global temperature, and presumably especially southern ocean temperature, appear to represent a major control on changes in atmospheric CO2.

Temperature-Change-Leads-CO2-Growth-Change-Humulum-2013.jpg


SAGE Journals: Your gateway to world-class research journals

CLIP: “[T]he warming and cooling of the ocean waters control how much CO2 is exchanged with atmosphere and thereby controlling the concentration of atmospheric CO2. It is obvious that when the oceans are cooled, in this case due to volcanic eruptions or La Niña events, they release less CO2 and when it was an extremely warm year, due to an El Niño, the oceans release more CO2. [D]uring the measured time 1979 to 2006 there has been a continued natural increase in temperature causing a continued increase of CO2 released into the atmosphere. This implies that temperature variations caused by El Niños, La Niñas, volcanic eruptions, varying cloud formations and ultimately the varying solar irradiation control the amount of CO2 which is leaving or being absorbed by the oceans.”


https://pubs.acs.org/doi/abs/10.1021/ef800581r

CLIP: “[With the short (5−15 year) RT [residence time] results shown to be in quasi-equilibrium, this then supports the (independently based) conclusion that the long-term (∼100 year) rising atmospheric CO2 concentration is not from anthropogenic sources but, in accordance with conclusions from other studies, is most likely the outcome of the rising atmospheric temperature, which is due to other natural factors. This further supports the conclusion that global warming is not anthropogenically driven as an outcome of combustion.”


Error - Cookies Turned Off

“[T]he trend in the airborne fraction [ratio of CO2 accumulating in the atmosphere to the CO2 flux into the atmosphere due to human activity] since 1850 has been 0.7 ± 1.4% per decade, i.e. close to and not significantly different from zero. The analysis further shows that the statistical model of a constant airborne fraction agrees best with the available data if emissions from land use change are scaled down to 82% or less of their original estimates. Despite the predictions of coupled climate-carbon cycle models, no trend in the airborne fraction can be found.”

Like it or not, that last sentence means that there simply is not a discernible trend in the percentage of atmospheric CO2 that can be linked to our emissions...that is because in the grand scheme of things, the amount of CO2 that we produce is very small...not even enough to have any measurable effect on the year to year variation of the earth's own CO2 making processes...

Here is a paper from James Hansen himself...the father of global warming and the high priest of anthropogenic climate change...

Climate forcing growth rates: doubling down on our Faustian bargain - IOPscience

CLIP: “However, it is the dependence of the airborne fraction on fossil fuel emission rate that makes the post-2000 downturn of the airborne fraction particularly striking. The change of emission rate in 2000 from 1.5% yr-1 [1960-2000] to 3.1% yr-1 [2000-2011], other things being equal, would [should] have caused a sharp increase of the airborne fraction”

erl459410f3_online.jpg


Then he goes on to note that it has warmed since the little ice age, and makes a big assed assumption that the reason that it has warmed is CO2...and as evidence that it is CO2, he points to an 18th century thought experiment... The fact is that every ice core ever done shows us that increased atmospheric CO2 is the result of warming temperatures, not the cause...

Hell your guy even calls the output of computer models "empirical evidence" NEWSFLASH...it isn't.

Thanks for trying, but alas, there is nothing there but assumption after assumption after assumption being called empirical evidence...he does provide some actual instrumental data, but that is nothing more than evidence that he is easily fooled by instrumentation. It is in the section where he supposedly shows measurements of back radiation...energy moving from the cooler atmosphere down to the warmer surface of the earth where said radiation actually warms the surface... Ever look at the second law of thermodynamics? Here...take a look:


Second Law of Thermodynamics: It is not possible for heat to flow from a colder body to a warmer body without any work having been done to accomplish this flow. Energy will not flow spontaneously from a low temperature object to a higher temperature object.

Which part of that suggests that energy will move from the cooler atmosphere down to the warmer surface of the earth? He uses instruments that are cooled to a temperature of about -80F. He isn't measuring energy moving from the cooler atmosphere to the warmer surface of the earth...he is measuring energy moving from the warmer atmosphere to the cooler instrument....if you place an identical instrument with the cooling turned off right next to the cooled one, you will get no measurement of energy moving from the cooler atmosphere to the warmer instrument because according to the second law of thermodynamics (the mother of all physical laws) energy won't move spontaneously from a cool object to a warmer object....

It is always interesting to see what passes for evidence among those who believe...at least this one isn't an opinion piece from a newspaper as most provide....it is at least pseudoscience masquerading as science.....
Let's not continue. You can not make a claim about something and then continue about something else when you can't defend that claim.
You said that Venus is hot because of the pressure of its atmosphere and used gas giants to defend it. I pointed out that Jupiter's pressure to temperature is 0.0066 percent. Venus has a ratio of 64 percent.
?

Finnish study finds ‘practically no’ evidence for man-made climate change

A new study conducted by a Finnish research team has found little evidence to support the idea of man-made climate change. The results of the study were soon corroborated by researchers in Japan.
In a paper published late last month, entitled ‘No experimental evidence for the significant anthropogenic climate change’, a team of scientists at Turku University in Finland determined that current climate models fail to take into account the effects of cloud coverage on global temperatures, causing them to overestimate the impact of human-generated greenhouse gasses.

Models used by official bodies such as the Intergovernmental Panel on Climate Change (IPCC) “cannot compute correctly the natural component included in the observed global temperature,” the study said, adding that “a strong negative feedback of the clouds is missing” in the models.
The paper attributes rising temperature during 1985–2005 almost entirely to decreasing low cloud cover, from which it infers a very low sensitivity of climate to rising CO2.

  1. Given that we have data for global climate, CO2 (from Law Dome ice cores before 1958), and total solar irradiance reconstructions, all covering the 169 years 1850–2018, the period 1985–2005 is going to contain a lot of spurious high frequency “chatter” in the signals most of which can be “tuned out” by considering far more data. When one does so, the combined influence of the sun and CO2 over 169 years explain climate far more accurately than is possible using only 20 years of data, with or without cloud cover data.
  2. For the period 1985-2005 they consider three variables: rising temperature, decreasing cloud cover, and rising CO2. Noting the negative correlation between the first two, their hypothesis is that the first is almost completely explained by the second. They conclude that there is therefore no need to implicate CO2 as a causal factor: even though CO2 has risen 47% during the industrial era, they claim it has a negligible effect on climate because that rise in temperature can be almost entirely attributed to cloud cover.
This line of reasoning is patently illogical: with equal logic one could prove that cloud cover has no significant effect on climate by attributing it all to CO2. Furthermore it is based purely on correlations over a short period and not on any physical mechanism such as the greenhouse effect that can be expected to remain valid over far longer periods than a mere 20 years.
Vaughan Pratt, Since 1972 taught classes on many topics at MIT and Stanford
https://www.quora.com/Why-is-Turku-...-the-significant-anthropogenic-climate-change


Oh really?


Winter monsoons became stronger during geomagnetic reversal: Revealing the impact of cosmic rays on the Earth's climate


The Svensmark Effect is a hypothesis that galactic cosmic rays induce low cloud formation and influence the Earth's climate. Tests based on recent meteorological observation data only show minute changes in the amounts of galactic cosmic rays and cloud cover, making it hard to prove this theory. However, during the last geomagnetic reversal transition, when the amount of galactic cosmic rays increased dramatically, there was also a large increase in cloud cover, so it should be possible to detect the impact of cosmic rays on climate at a higher sensitivity.

In the Chinese Loess Plateau, just south of the Gobi Desert near the border of Mongolia, dust has been transported for 2.6 million years to form loess layers -- sediment created by the accumulation of wind-blown silt -- that can reach up to 200 meters in thickness. If the wind gets stronger, the coarse particles are carried further, and larger amounts are transported. Focusing on this phenomenon, the research team proposed that winter monsoons became stronger under the umbrella effect of increased cloud cover during the geomagnetic reversal. They investigated changes in particle size and accumulation speed of loess layer dust in two Loess Plateau locations.
What does any of this got to do with the link you provided? It's just another link that hypothesizes something they want to study but haven't. Nothing in it even tries to deny the greenhouse effect. Just searches for another possible explanation besides man.


Wait a second the earth has been changing for 4.5 billion years , man has been driving cars for a 100 years?
Sure and earth has been both hotter and colder. I have little doubt that mankind will survive AGW. What I am less sure of is if mankind will survive AGW without severely crippling the ecosystem. That it will survive without having to take drastic measures to safeguard its cities. That it will survive without wars breaking out as resources like drinkable water get harder to come by. We are a very adaptable species and will survive, after all, we have survived worse. Surviving is not the same as thriving tough.


Wait water can be destroyed?
 
Let's not continue. You can not make a claim about something and then continue about something else when you can't defend that claim.
You said that Venus is hot because of the pressure of its atmosphere and used gas giants to defend it. I pointed out that Jupiter's pressure to temperature is 0.0066 percent. Venus has a ratio of 64 percent.
The paper attributes rising temperature during 1985–2005 almost entirely to decreasing low cloud cover, from which it infers a very low sensitivity of climate to rising CO2.

  1. Given that we have data for global climate, CO2 (from Law Dome ice cores before 1958), and total solar irradiance reconstructions, all covering the 169 years 1850–2018, the period 1985–2005 is going to contain a lot of spurious high frequency “chatter” in the signals most of which can be “tuned out” by considering far more data. When one does so, the combined influence of the sun and CO2 over 169 years explain climate far more accurately than is possible using only 20 years of data, with or without cloud cover data.
  2. For the period 1985-2005 they consider three variables: rising temperature, decreasing cloud cover, and rising CO2. Noting the negative correlation between the first two, their hypothesis is that the first is almost completely explained by the second. They conclude that there is therefore no need to implicate CO2 as a causal factor: even though CO2 has risen 47% during the industrial era, they claim it has a negligible effect on climate because that rise in temperature can be almost entirely attributed to cloud cover.
This line of reasoning is patently illogical: with equal logic one could prove that cloud cover has no significant effect on climate by attributing it all to CO2. Furthermore it is based purely on correlations over a short period and not on any physical mechanism such as the greenhouse effect that can be expected to remain valid over far longer periods than a mere 20 years.
Vaughan Pratt, Since 1972 taught classes on many topics at MIT and Stanford
https://www.quora.com/Why-is-Turku-...-the-significant-anthropogenic-climate-change


Oh really?


Winter monsoons became stronger during geomagnetic reversal: Revealing the impact of cosmic rays on the Earth's climate


The Svensmark Effect is a hypothesis that galactic cosmic rays induce low cloud formation and influence the Earth's climate. Tests based on recent meteorological observation data only show minute changes in the amounts of galactic cosmic rays and cloud cover, making it hard to prove this theory. However, during the last geomagnetic reversal transition, when the amount of galactic cosmic rays increased dramatically, there was also a large increase in cloud cover, so it should be possible to detect the impact of cosmic rays on climate at a higher sensitivity.

In the Chinese Loess Plateau, just south of the Gobi Desert near the border of Mongolia, dust has been transported for 2.6 million years to form loess layers -- sediment created by the accumulation of wind-blown silt -- that can reach up to 200 meters in thickness. If the wind gets stronger, the coarse particles are carried further, and larger amounts are transported. Focusing on this phenomenon, the research team proposed that winter monsoons became stronger under the umbrella effect of increased cloud cover during the geomagnetic reversal. They investigated changes in particle size and accumulation speed of loess layer dust in two Loess Plateau locations.
What does any of this got to do with the link you provided? It's just another link that hypothesizes something they want to study but haven't. Nothing in it even tries to deny the greenhouse effect. Just searches for another possible explanation besides man.


Wait a second the earth has been changing for 4.5 billion years , man has been driving cars for a 100 years?
Sure and earth has been both hotter and colder. I have little doubt that mankind will survive AGW. What I am less sure of is if mankind will survive AGW without severely crippling the ecosystem. That it will survive without having to take drastic measures to safeguard its cities. That it will survive without wars breaking out as resources like drinkable water get harder to come by. We are a very adaptable species and will survive, after all, we have survived worse. Surviving is not the same as thriving tough.


Wait water can be destroyed?
Nope, but drinking water can become scarce as less of it becomes available.
 
Last edited:
Oh really?


Winter monsoons became stronger during geomagnetic reversal: Revealing the impact of cosmic rays on the Earth's climate


The Svensmark Effect is a hypothesis that galactic cosmic rays induce low cloud formation and influence the Earth's climate. Tests based on recent meteorological observation data only show minute changes in the amounts of galactic cosmic rays and cloud cover, making it hard to prove this theory. However, during the last geomagnetic reversal transition, when the amount of galactic cosmic rays increased dramatically, there was also a large increase in cloud cover, so it should be possible to detect the impact of cosmic rays on climate at a higher sensitivity.

In the Chinese Loess Plateau, just south of the Gobi Desert near the border of Mongolia, dust has been transported for 2.6 million years to form loess layers -- sediment created by the accumulation of wind-blown silt -- that can reach up to 200 meters in thickness. If the wind gets stronger, the coarse particles are carried further, and larger amounts are transported. Focusing on this phenomenon, the research team proposed that winter monsoons became stronger under the umbrella effect of increased cloud cover during the geomagnetic reversal. They investigated changes in particle size and accumulation speed of loess layer dust in two Loess Plateau locations.
What does any of this got to do with the link you provided? It's just another link that hypothesizes something they want to study but haven't. Nothing in it even tries to deny the greenhouse effect. Just searches for another possible explanation besides man.


Wait a second the earth has been changing for 4.5 billion years , man has been driving cars for a 100 years?
Sure and earth has been both hotter and colder. I have little doubt that mankind will survive AGW. What I am less sure of is if mankind will survive AGW without severely crippling the ecosystem. That it will survive without having to take drastic measures to safeguard its cities. That it will survive without wars breaking out as resources like drinkable water get harder to come by. We are a very adaptable species and will survive, after all, we have survived worse. Surviving is not the same as thriving tough.


Wait water can be destroyed?
Nope, but water can become scarce as less of it is in the form of fresh water.

It's not water we drink dinosaur piss right now, it's sand..

The world is running out of sand — and there's a black market for it now


Educate yourself, please and thank you
 
In fact, satellites have detected an increase in outgoing long wave radiation, and the increase has been going on for quite some time. Here, as measured by NOAA...


noaa-northern-hemisphere-olr-monthly-anomalies.png
This tracks 100% with SHO (Solar Helio Observatory) solar output. The input and out put track in parallel, indicating that the earth is shedding energy just as fast as it receives it. Something the AGW crowd doesn't want you to know.
 
Your argument is totally irrelevant to the simple fact that as atmospheric CO2 increases due to burning of fossil fuels, more CO2 is absorbed by the oceans and they become more acidic. It's damaging the corals, but they will adapt and survive, or other forms will evolve.
Several studies have now disproved this.

Nonsense. Basic chemistry has not changed.
 
Status
Not open for further replies.

Forum List

Back
Top