edthecynic
Censored for Cynicism
- Oct 20, 2008
- 43,044
- 6,883
- 1,830
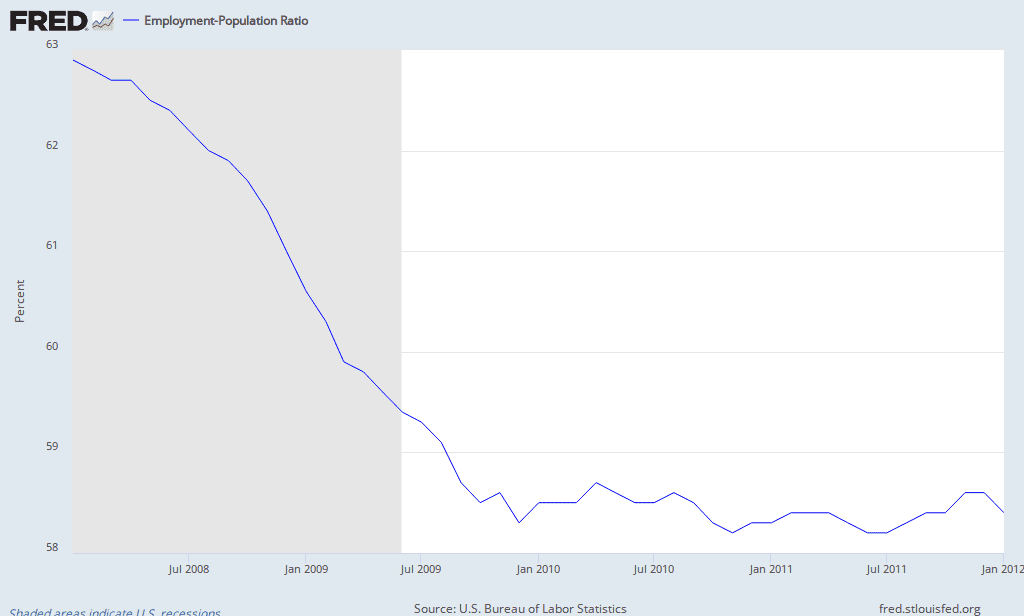
You are new here, I always have sources.Since 2008 you have had about 7,500 Boomers retiring at age 62 EVERY DAY, the earliest age they are able to collect!!! If you don't think that has had a significant effect on the labor force/population ratio, enough to make it a useless measurement of economic activity, then I don't know what else to say.Cultural shifts. So I'll ask again: do you honestly believe that during the recession a whole bunch of people just decided to leave/not join the labour force for an unrelated reason, causing the employment to population ratio to permanently fall so many points? If you think no, like I do, then employment-population is a decent measure which isn't thrown off by the fact that workers become "discouraged" during downturns.
Source?
http://liber8.stlouisfed.org/newsletter/2008/200803.pdf
Baby Boomer Retirement March 2008
Over the course of the next two decades, an average of 10,000 baby boomers per day will reach retirement age.
Ideation Insurance Group
Approximately 3 out of 4 Americans start claiming Social Security benefits the moment they are eligible at age 62.