Sea Surface Temps Continue Plunge

Sinatra

Senior Member
Feb 5, 2009
8,013
1,008
48
Dr. Spencer bringing out some more strong data that flies in the face of all the rushed together doom-n-gloom warmer news that is attempting to coincide with the BP oil leak...

____

Global Average Sea Surface Temperatures Continue their Plunge

Sea Surface Temperatures (SSTs) measured by the AMSR-E instrument on NASA’s Aqua satellite continue their plunge as a predicted La Nina approaches. The following plot, updated through yesterday (June 17, 2010) shows that the cooling in the Nino34 region in the tropical east Pacific is well ahead of the cooling in the global average SST, something we did not see during the 2007-08 La Nina event

...At this pace of cooling, I suspect that the second half of 2010 could ruin the chances of getting a record high global temperature for this year. Oh, darn.
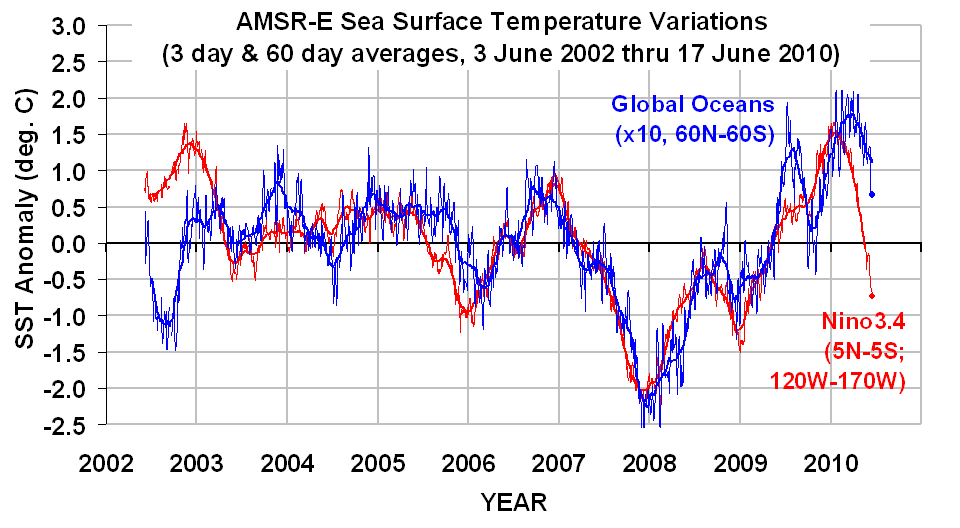

AMSRE-SST-Global-and-Nino34-thru-June-17-2010.gif
 
Of course sea surface temps are plunging.
Plastic reflects sunlight.
And those melting icecaps put out lots of cold water.
 
Dr. Spencer bringing out some more strong data that flies in the face of all the rushed together doom-n-gloom warmer news that is attempting to coincide with the BP oil leak...

____

Global Average Sea Surface Temperatures Continue their Plunge

Sea Surface Temperatures (SSTs) measured by the AMSR-E instrument on NASA’s Aqua satellite continue their plunge as a predicted La Nina approaches. The following plot, updated through yesterday (June 17, 2010) shows that the cooling in the Nino34 region in the tropical east Pacific is well ahead of the cooling in the global average SST, something we did not see during the 2007-08 La Nina event

...At this pace of cooling, I suspect that the second half of 2010 could ruin the chances of getting a record high global temperature for this year. Oh, darn.


AMSRE-SST-Global-and-Nino34-thru-June-17-2010.gif

Interesting, the global ocean temperature is actually below prior highs, but nowhere near the lows.

Besides, how could we possibly be on track for a record year? Remember, it is cooling. It is cooling. It is cooling. It is.........
 
Again I want to emphasize that my use of the temperature change rate, rather than temperature, as the predicted variable is based upon the expectation that these natural modes of climate variability represent forcing mechanisms — I believe through changes in cloud cover — which then cause a lagged temperature response.

This is powerful evidence that most of the warming that the IPCC has attributed to human activities over the last 50 years could simply be due to natural, internal variability in the climate system. If true, this would also mean that (1) the climate system is much less sensitive to the CO2 content of the atmosphere than the IPCC claims, and (2) future warming from greenhouse gas emissions will be small.


Roy Spencer, Ph. D.
 
In the race for the hottest calendar year, 1998 still leads with the daily average for 1 Jan to 31 May being +0.65 C in 1998 compared with +0.59 C for 2010. (Note that these are not considered significantly different.) As of 31 May 2010, there have been 151 days in the year. From our calibrated daily data, we find that 1998 was warmer than 2010 on 96 of them.


Roy Spencer, Ph. D.
 
The temperatures must be plunging because of the melting polar ice caps, amiright?

Here's an experiment: take a glass of tap water and measure the temperature, then dump a handful of ice cubes and remeasure. See? Global Warming causes lower water temperatures!

Can I be one of them Global Warming "Scientists"?
 
Last edited:
Warmers Unite!!!

Al Gore commands you!!!!

Dr. Spencer bringing out some more strong data that flies in the face of all the rushed together doom-n-gloom warmer news that is attempting to coincide with the BP oil leak...

____

Global Average Sea Surface Temperatures Continue their Plunge

Sea Surface Temperatures (SSTs) measured by the AMSR-E instrument on NASA’s Aqua satellite continue their plunge as a predicted La Nina approaches. The following plot, updated through yesterday (June 17, 2010) shows that the cooling in the Nino34 region in the tropical east Pacific is well ahead of the cooling in the global average SST, something we did not see during the 2007-08 La Nina event

...At this pace of cooling, I suspect that the second half of 2010 could ruin the chances of getting a record high global temperature for this year. Oh, darn.


AMSRE-SST-Global-and-Nino34-thru-June-17-2010.gif
 
In the race for the hottest calendar year, 1998 still leads with the daily average for 1 Jan to 31 May being +0.65 C in 1998 compared with +0.59 C for 2010. (Note that these are not considered significantly different.) As of 31 May 2010, there have been 151 days in the year. From our calibrated daily data, we find that 1998 was warmer than 2010 on 96 of them.


Roy Spencer, Ph. D.

Since the error with the + and - signs, Dr. Spencer has been a bit more carefull to add notes like the one in red to cover his ass.


No, any legit scientist will do that. You will notice that the warmers will universally cite a .5 degree rise over a 100 year period while ignoring the very simple fact that that is statistically insignificant. But they will howl and yowl about the massive temp increase.

Silly wabbits.
 
In the race for the hottest calendar year, 1998 still leads with the daily average for 1 Jan to 31 May being +0.65 C in 1998 compared with +0.59 C for 2010. (Note that these are not considered significantly different.) As of 31 May 2010, there have been 151 days in the year. From our calibrated daily data, we find that 1998 was warmer than 2010 on 96 of them.


Roy Spencer, Ph. D.

Since the error with the + and - signs, Dr. Spencer has been a bit more carefull to add notes like the one in red to cover his ass.


No, any legit scientist will do that. You will notice that the warmers will universally cite a .5 degree rise over a 100 year period while ignoring the very simple fact that that is statistically insignificant. But they will howl and yowl about the massive temp increase
.

Silly wabbits.

____

:clap2::clap2::clap2:

Exactly - Spencer is reinforcing his long held position that the half-degree fluctuations so often cited as dire doom n gloom by the warmers is not actually that significant and well wthin the bounds of normal temperature fluctuations.

Dr. Spencer has long been a voice of moderation in the ongoing global warming debate - admitting that yes, humankind plays some role in impacting global temps, but that role is quite minor when compared to other far more significant factors that humankind has no impact on.

Given the discovery of data manipulation by some of the warmers, the moderation approach by Dr. Spencer is now thankfully in favor...
 
In favor and totally wrong.


What was that about being wrong?

Here is an abridged list of all the "mistakes" the warmers have been caught making.

It's a funny read enjoy!

Gate Blowup! Come On In Gate Lovers! P Gosselin – NoTricksZone


Indeed - the crap that the institutionalized global warming machine has been pulling for nearly 30 years is astounding - and a terrible blow to the credibility of climate science.

Figures like Dr. Spencer are attempting to bring some degree of responsible sanity back to a study that has been bereft of factual science for far too long...
 
Dr. Spencer bringing out some more strong data that flies in the face of all the rushed together doom-n-gloom warmer news that is attempting to coincide with the BP oil leak...

____

Global Average Sea Surface Temperatures Continue their Plunge

Sea Surface Temperatures (SSTs) measured by the AMSR-E instrument on NASA’s Aqua satellite continue their plunge as a predicted La Nina approaches. The following plot, updated through yesterday (June 17, 2010) shows that the cooling in the Nino34 region in the tropical east Pacific is well ahead of the cooling in the global average SST, something we did not see during the 2007-08 La Nina event

...At this pace of cooling, I suspect that the second half of 2010 could ruin the chances of getting a record high global temperature for this year. Oh, darn.


AMSRE-SST-Global-and-Nino34-thru-June-17-2010.gif
Since Spencer and Christy can't fudge the troposphere numbers to show global cooling by using the opposite sign to correct for diurnal satellite drift any more and they show global warming, suddenly sea surface temps replaces the troposphere temps as the final say for the WHOLE globe. Land temps and troposphere temps are now suddenly meaningless. That is until the sea surface temps show warming and then it will be the stratosphere or the moon or something else that will be used to deny global warming.

The funny thing is global sea temps from 90 north to 90 south show warming for winter and spring of this year as opposed to Spencer using only 60 north to 60 south for his cooling.

get-file.php


get-file.php


get-file.php


get-file.php
 

Forum List

Back
Top