Sea Levels Rising 60% Faster Than Projected, Planet Keeps Warming As Expected

Bodies washing out of WWII graves...
:eek:
Rising seas wash Japanese war dead from Marshall Islands graves
Friday 6 June 2014 ~ Officials blame climate change as 26 skeletons are found on Santo Island after high tides batter Pacific archipelago
Rising sea levels have washed the remains of at least 26 Japanese second world war soldiers from their graves on a low-lying Pacific archipelago, the foreign minister of the Marshall Islands has said. "There are coffins and dead people being washed away from graves. It's that serious," Tony de Brum told reporters on the sidelines of United Nations climate change talks in Germany. Putting the blame on climate change, which threatens the existence of the islands, which are only 2 metres (6ft) above sea level at their highest, De Brum said: "Even the dead are affected".

Marshall-Islands-011.jpg

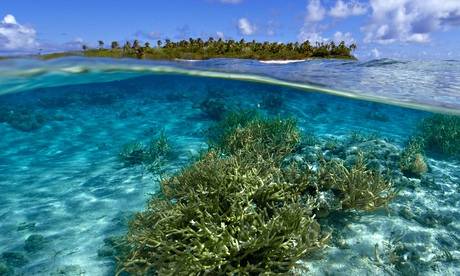
Marshall Islands. A UN report said changes in winds and currents meant Pacific sea levels had risen faster than the world average since the 1990s.

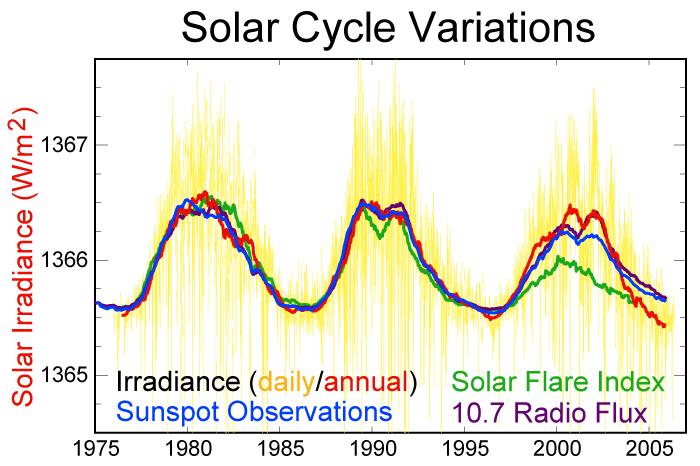
Twenty-six skeletons had been found on Santo Island after high tides battered the archipelago from February to April, he said, adding that more may be found. "We think they are Japanese soldiers. We had the exhumed skeletons sampled by the US Navy in Pearl Harbour [in Hawaii] and they helped identify where they are from, to assist in the repatriation efforts." Unexploded bombs and other military equipment had also washed up in recent months. Climate scientists say global warming has raised average world sea levels by about 19cm (8in) in the past century, aggravating the impact of storm surges and tides. Glaciers and ice caps are melting and water also expands as it warms.

A UN report said on Thursday that changes in Pacific winds and currents meant sea levels in the region had risen faster than the world average since the 1990s. De Brum said many of the 170 nations meeting in Bonn were slowly understanding the extent of threats faced by island states. Rising tides washed salt water on to the land, often ruining vegetation and crops, such as breadfruit and coconuts. "We think they are [getting the message], but not quickly enough to climate-proof some of our more vulnerable communities," he said. Climate-proofing measures included raising homes on stilts, rebuilding roads and docks, and even the abandonment of some atolls.

Rising seas wash Japanese war dead from Marshall Islands graves | World news | theguardian.com
 
Interesting Waltky, could be rising seas or just erosion patterns from storms.
That island has been doomed for over a hundred years at this point, climatically speaking...

I will offer them $150K cash money for it tho :D
 
Interesting Waltky, could be rising seas or just erosion patterns from storms.
That island has been doomed for over a hundred years at this point, climatically speaking...

I will offer them $150K cash money for it tho :D

No, it couldn't be erosion. In the days of GPS, geocentric elevation is an easily determined measurement.
 
What 60% BS??? Ive heard numbers more like 480% and a few estimates over 1,000%!!! Depends on which k00k's numbers you want to embrace. I'll go with the 250% number and play it straight down the middle!!
 
FCT, 3.2 mm/yr IS 60% greater than 2.0 mm/yr. Here is the text that accompanied that graphic.

3. Global sea-level rise
Turning to sea level, the quasi linear trend measured by satellite altimeters since 1993 has continued essentially unchanged when extending the time series by five additional years. It continues to run near the upper limit of the projected uncertainty range given in the third and fourth IPCC assessment reports (figure 2). Here, the sea-level projections provided in figure 5 of the summary for policy makers of the third assessment and in table SPM.3 of the fourth assessment are shown. The satellite-based linear trend 1993–2011 is 3.2 ± 0.5 mm yr−1, which is 60% faster than the best IPCC estimate of 2.0 mm yr−1 for the same interval (blue lines). The two temporary sea-level minima in 2007/2008 and 2010/2011 may be linked to strong La Niña events (Llovel et al 2011). The tide gauges show much greater variability, most likely since their number is too limited to properly sample the global average (Rahmstorf et al 2012). For sea level the fourth IPCC report did not publish the model-based time series (green lines), but these were made available online in 2012 (CSIRO 2012). They do not differ significantly from the projections of the third IPCC report and thus continue to underestimate the observed upward trend.

***********************************************************************************************

The multiple blue and green lines show the lowest and highest of the multiple scenarios for which the IPCC produced projections. The actual data is 60% higher than the mean of those earlier projections. That is not lying, that is presenting data reasonably and accurately.

Sea levels are rising 60% faster than the IPCC's best estimate. And this despite atmospheric temperatures leveling. Hmm... maybe Balmaseda, Trenberth and Kallen could explain what's happening.

Complete and UTTER BullShit... The IPCC NEVER projected 2mm/yr in AR3 or AR4 as most likely or most probable..

By then --- they had 15 YEARS of satellite readings of 3.0 mm/yr trend lines.. As I quoted from the FAQ section of AR4...

From https://www.ipcc.ch/publications_and_data/ar4/wg1/en/ch10s10-es-8-sea-level.html (AKA AR4)

Sea level is projected to rise between the present (1980–1999) and the end of this century (2090–2099) under the SRES B1 scenario by 0.18 to 0.38 m, B2 by 0.20 to 0.43 m, A1B by 0.21 to 0.48 m, A1T by 0.20 to 0.45 m, A2 by 0.23 to 0.51 m, and A1FI by 0.26 to 0.59 m. These are 5 to 95% ranges based on the spread of AOGCM results, not including uncertainty in carbon cycle feedbacks. For each scenario, the midpoint of the range is within 10% of the TAR model average for 2090-2099. The ranges are narrower than in the TAR mainly because of improved information about some uncertainties in the projected contributions. In all scenarios, the average rate of rise during the 21st century very likely exceeds the 1961 to 2003 average rate (1.8 ± 0.5 mm yr–1). During 2090 to 2099 under A1B, the central estimate of the rate of rise is 3.8 mm yr–1. For an average model, the scenario spread in sea level rise is only 0.02 m by the middle of the century, and by the end of the century it is 0.15 m.

AND --- I have no f-ing idea what you are quoting from when you say "text of that graphic".. Are those the words of the lying Joe Romm??? Give a link please..

Not Joe Romm but rather Stefan Rahmstorf, Grant Foster and Anny Cazenave at:
http://iopscience.iop.org/1748-9326/7/4/044035/article

Abstract
We analyse global temperature and sea-level data for the past few decades and compare them to projections published in the third and fourth assessment reports of the Intergovernmental Panel on Climate Change (IPCC). The results show that global temperature continues to increase in good agreement with the best estimates of the IPCC, especially if we account for the effects of short-term variability due to the El Niño/Southern Oscillation, volcanic activity and solar variability. The rate of sea-level rise of the past few decades, on the other hand, is greater than projected by the IPCC models. This suggests that IPCC sea-level projections for the future may also be biased low. --Full article available at link (including those mysterious graphics)


This is desparation with sweat coming from every pore.. And pretty soon, even the mental midgets will recognize the distortion of truth.


Sorry to disappoint you but you have never invoked in me the slightest sense of desperation - save at the heroic levels you and yours attain on the scale of unteachability.
 
Last edited:

Sea Level Rise Much Slower Than Predicted

Sea Level Rise Much Slower Than Predicted

A new, first-of-its-kind comprehensive scientific analysis has shown that there is little to fear from rising sea levels driven by global warming. The likelihood is that the 21st century will see rises much like those of the 20th, and even in the worst possible case sea levels in 2100 will be far below those foreseen by alarmists.—Lewis Page, The Register, 3 October 2012

You stupid retard. No referance to the author of the article, what journal it was published in, or what it actually said in terms of numbers. I would say, given that the the Canada Free Press, that it is flat out bogus. No such study exists.

I think you mental level is the same as your avatar.
 
The fact that you guys keep making these "sky is falling" claims when direct observation slaps you down most cruelly simply boggles the mind.

THE HOCKEY SCHTICK: Paper: Sea Level Rise Not Accelerating (Journal of Geophysical Research - Oceans)


THE HOCKEY SCHTICK: New paper shows sea levels around Australia have declined over the past 7000 years (Quaternary Science Reviews)

THE HOCKEY SCHTICK: Sea Level Change: The Last 120 Million Years

THE HOCKEY SCHTICK: Sea levels were much higher and ice sheets less stable 120,000 years ago with 'safe' CO2 levels (Nature Geoscience)

THE HOCKEY SCHTICK: New paper finds sea level trends are biased by natural ocean oscillations (Geophysical Research Letters)

THE HOCKEY SCHTICK: Inconvenient Truth: Sea Level Rise has Decelerated 44% since 2005 (Ocean Science)

THE HOCKEY SCHTICK: Sea level rise in Southwest Pacific dropped by factor of 6 during latter half of 20th century (Earth and Planetary Science Letters)

THE HOCKEY SCHTICK: Settled science update: 'Greenhouse gases' don't cause sea level rise (The Journal of Climate)

THE HOCKEY SCHTICK: New paper finds sea level rise has greatly decelerated over past 10 years ( Coastal Engineering )

THE HOCKEY SCHTICK: New paper shows sea level rise of less than 7 inches per century with no acceleration (Journal of Geophysical Research)

THE HOCKEY SCHTICK: Analysis finds satellite data has been continuously 'adjusted' to exaggerate sea level rise

THE HOCKEY SCHTICK: New paper finds sea level changes since 1950 have been due to natural variability (Climate of the Past)

The Hockeyschtick, like you, is engaged in lying. The article did not deal with worldwide ocean levels, only those around New Zealand.

Regional sea level trends in New Zealand - Hannah - 2012 - Journal of Geophysical Research: Oceans (1978?2012) - Wiley Online Library

Abstract
[1] In terms of sea level data sets able to be used for long-term sea level trend analysis, the Southern Hemisphere is a data sparse region of the world. New Zealand lies in this region, presently having four (major port) data sets used for such trend analysis. This paper describes the process followed to compute new sea level trends at another six ports, each with very discontinuous tide gauge records. In each case the tide gauge has previously only been used for precisely defining an historical local Mean Sea Level (MSL) datum. The process used involved a comparison of the old MSL datum with a newly defined datum obtained from sea level data covering the last decade. A simple linear trend was fitted between the two data points. Efforts were then made to assess possible bias in the results due to oceanographic factors such as the El Niño–Southern Oscillation (ENSO) cycle, and the Interdecadal Pacific Oscillation (IPO). This was done by taking the longer time series from the four major ports and assessing the spatially coherent variability in annual sea level using the dominant principal component from an empirical orthogonal function (EOF) analysis. The average relative sea level rise calculated from these six newly derived trends was 1.7 ± 0.1 mm yr−1, a result that is completely consistent with the analysis of the long-term gauge records. Most importantly, it offers a relatively simple method of improving our knowledge of relative sea level trends in data sparse regions of the world.
 
We'll your cult should start praying real hard and then have Obama wave his globull warming wand to, make the seas stop rising

or we're all going TO DIE
 
We'll your cult should start praying real hard and then have Obama wave his globull warming wand to, make the seas stop rising

or we're all going TO DIE

Staph, old girl, why don't you just hang a sign around your neck declaring that you are brain dead. Save everyone the effort of reading your ignorant and silly postings.
 
Everyone grab one of these. Hurry.

Disclaimer..........Women not included with life Jacket. You will be taxed on the sale of all items purchased from this site.

Anyway, WE ARE ALL GOING TO DIE. BUY THE LIFE JACKET.............

woman-wearing-life-jacket-beach-7430811.jpg
 
DUH!!! YES!!! ALL THE PLANETS THAT CIRCLE OUR SUN ARE WARMING. WHY??? ANSWER= THE SUN!!! DUH!!! YES!!! THE SUN HAS WARMING CYCLES and we are in a warming cycle.
 
The sun is currently COOLING.

Solar-cycle-data.png


PS, the rest of the planets that circle our sun are not warming.
 
Last edited:
the op is the chicken little of the board

runs around screeching, we are all going , we are going to die
 
Im laughing......the ENVIRONMENT forum has become a Philosophy forum!!!


Ummm......ahhhh hemmmmm........the models are bogus!! Everyone knows it too!! Well......70% of the population does!!!
 
The environment buzz is all smoke and mirrors to make the peace creeps feel like their worthless lives have meaning.

Forecast for Palm Springs is 100+ OMG!

-Geaux
 
FCT, 3.2 mm/yr IS 60% greater than 2.0 mm/yr. Here is the text that accompanied that graphic.

3. Global sea-level rise
Turning to sea level, the quasi linear trend measured by satellite altimeters since 1993 has continued essentially unchanged when extending the time series by five additional years. It continues to run near the upper limit of the projected uncertainty range given in the third and fourth IPCC assessment reports (figure 2). Here, the sea-level projections provided in figure 5 of the summary for policy makers of the third assessment and in table SPM.3 of the fourth assessment are shown. The satellite-based linear trend 1993–2011 is 3.2 ± 0.5 mm yr−1, which is 60% faster than the best IPCC estimate of 2.0 mm yr−1 for the same interval (blue lines). The two temporary sea-level minima in 2007/2008 and 2010/2011 may be linked to strong La Niña events (Llovel et al 2011). The tide gauges show much greater variability, most likely since their number is too limited to properly sample the global average (Rahmstorf et al 2012). For sea level the fourth IPCC report did not publish the model-based time series (green lines), but these were made available online in 2012 (CSIRO 2012). They do not differ significantly from the projections of the third IPCC report and thus continue to underestimate the observed upward trend.

***********************************************************************************************

The multiple blue and green lines show the lowest and highest of the multiple scenarios for which the IPCC produced projections. The actual data is 60% higher than the mean of those earlier projections. That is not lying, that is presenting data reasonably and accurately.

Sea levels are rising 60% faster than the IPCC's best estimate. And this despite atmospheric temperatures leveling. Hmm... maybe Balmaseda, Trenberth and Kallen could explain what's happening.

Complete and UTTER BullShit... The IPCC NEVER projected 2mm/yr in AR3 or AR4 as most likely or most probable..

By then --- they had 15 YEARS of satellite readings of 3.0 mm/yr trend lines.. As I quoted from the FAQ section of AR4...

From https://www.ipcc.ch/publications_and_data/ar4/wg1/en/ch10s10-es-8-sea-level.html (AKA AR4)

Sea level is projected to rise between the present (1980–1999) and the end of this century (2090–2099) under the SRES B1 scenario by 0.18 to 0.38 m, B2 by 0.20 to 0.43 m, A1B by 0.21 to 0.48 m, A1T by 0.20 to 0.45 m, A2 by 0.23 to 0.51 m, and A1FI by 0.26 to 0.59 m. These are 5 to 95% ranges based on the spread of AOGCM results, not including uncertainty in carbon cycle feedbacks. For each scenario, the midpoint of the range is within 10% of the TAR model average for 2090-2099. The ranges are narrower than in the TAR mainly because of improved information about some uncertainties in the projected contributions. In all scenarios, the average rate of rise during the 21st century very likely exceeds the 1961 to 2003 average rate (1.8 ± 0.5 mm yr–1). During 2090 to 2099 under A1B, the central estimate of the rate of rise is 3.8 mm yr–1. For an average model, the scenario spread in sea level rise is only 0.02 m by the middle of the century, and by the end of the century it is 0.15 m.

AND --- I have no f-ing idea what you are quoting from when you say "text of that graphic".. Are those the words of the lying Joe Romm??? Give a link please..

Not Joe Romm but rather Stefan Rahmstorf, Grant Foster and Anny Cazenave at:
Comparing climate projections to observations up to 2011 - IOPscience

Abstract
We analyse global temperature and sea-level data for the past few decades and compare them to projections published in the third and fourth assessment reports of the Intergovernmental Panel on Climate Change (IPCC). The results show that global temperature continues to increase in good agreement with the best estimates of the IPCC, especially if we account for the effects of short-term variability due to the El Niño/Southern Oscillation, volcanic activity and solar variability. The rate of sea-level rise of the past few decades, on the other hand, is greater than projected by the IPCC models. This suggests that IPCC sea-level projections for the future may also be biased low. --Full article available at link (including those mysterious graphics)


This is desparation with sweat coming from every pore.. And pretty soon, even the mental midgets will recognize the distortion of truth.


Sorry to disappoint you but you have never invoked in me the slightest sense of desperation.
 
Interesting Waltky, could be rising seas or just erosion patterns from storms.
That island has been doomed for over a hundred years at this point, climatically speaking...

I will offer them $150K cash money for it tho :D

No, it couldn't be erosion. In the days of GPS, geocentric elevation is an easily determined measurement.

Is that how you do research?? By assuming every atoll with more than 2 palms has had a full geological survey anytime in the past 50 years? Its just your way of AVOIDING any critical, non biased thought. Because you are a moron zealot.
 

Forum List

Back
Top