Measuring global temperatures: Satellites or thermometers?
"
Three Ways to Measure Global Temperatures
The primary ways to monitor global average air temperatures are surface based thermometers (since the late 1800s), radiosondes (weather balloons, since about the 1950s), and satellites measuring microwave emissions (since 1979). Other technologies, such as GPS satellite based methods have limited record length and have not yet gained wide acceptance for accuracy.
While the thermometers measure near-surface temperature, the satellites and radiosondes measure the average temperature of a deep layer of the lower atmosphere. Based upon our understanding of how the atmosphere works, the deep layer temperatures are supposed to warm (and cool) somewhat more strongly than the surface temperatures. In other words, variations in global average temperature are expected to be magnified with height, say through the lowest 10 km of atmosphere. We indeed see this during warm El Nino years (like 2015) and cool La Nina years.
The satellite record is the shortest, and since most warming has occurred since the 1970s anyway we often talk about temperature trends since 1979 so that we can compare all three datasets over a common period.
Temperatures of the deep ocean, which I will not address in detail, have warmed by amounts so small — hundredths of a degree — that it is debatable whether they are accurate enough to be of much use. Sea surface temperatures, also indicating modest warming in recent decades, involve an entirely new set of problems, with rather sparse sampling by a mixture of bucket temperatures from many years ago, to newer ship engine intake temperatures, buoys, and since the early 1980s infrared satellite measurements.
"
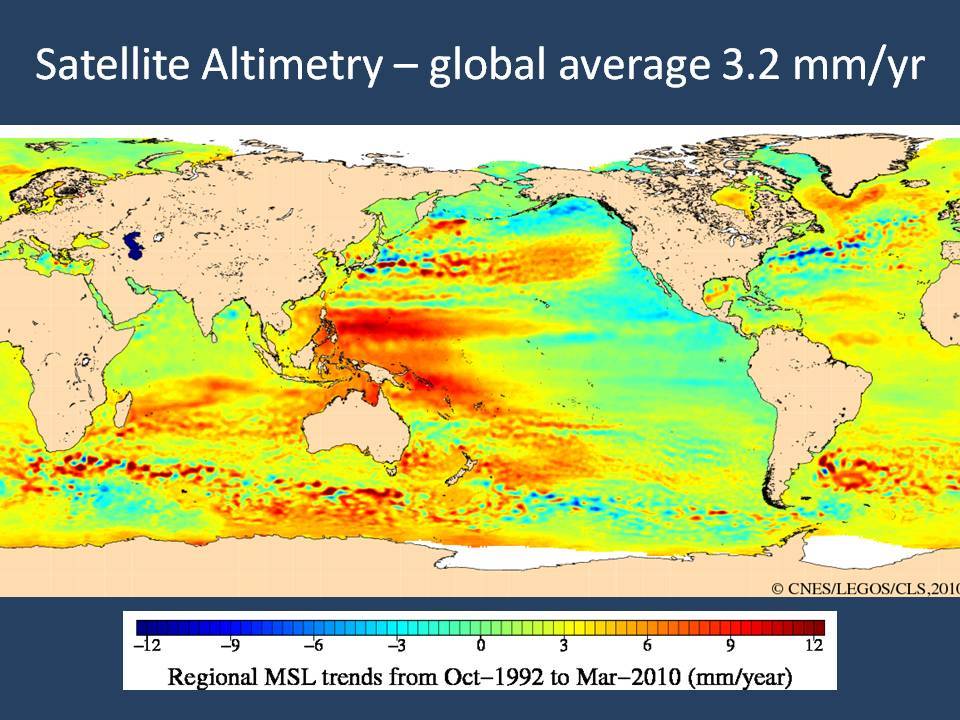
satellite measurements appear to be on the 'hit' list right now. just remember that the problems for one satellite are the problems for all satellites. if you want to toss out temperatures then you have to toss out sea level rise and ice mass as well. at least with satellite temps there are two distinct groups, with different affiliations, keeping an eye on each other. the other types of satellite measurements, not so much.
"
Three Ways to Measure Global Temperatures
The primary ways to monitor global average air temperatures are surface based thermometers (since the late 1800s), radiosondes (weather balloons, since about the 1950s), and satellites measuring microwave emissions (since 1979). Other technologies, such as GPS satellite based methods have limited record length and have not yet gained wide acceptance for accuracy.
While the thermometers measure near-surface temperature, the satellites and radiosondes measure the average temperature of a deep layer of the lower atmosphere. Based upon our understanding of how the atmosphere works, the deep layer temperatures are supposed to warm (and cool) somewhat more strongly than the surface temperatures. In other words, variations in global average temperature are expected to be magnified with height, say through the lowest 10 km of atmosphere. We indeed see this during warm El Nino years (like 2015) and cool La Nina years.
The satellite record is the shortest, and since most warming has occurred since the 1970s anyway we often talk about temperature trends since 1979 so that we can compare all three datasets over a common period.
Temperatures of the deep ocean, which I will not address in detail, have warmed by amounts so small — hundredths of a degree — that it is debatable whether they are accurate enough to be of much use. Sea surface temperatures, also indicating modest warming in recent decades, involve an entirely new set of problems, with rather sparse sampling by a mixture of bucket temperatures from many years ago, to newer ship engine intake temperatures, buoys, and since the early 1980s infrared satellite measurements.
"
satellite measurements appear to be on the 'hit' list right now. just remember that the problems for one satellite are the problems for all satellites. if you want to toss out temperatures then you have to toss out sea level rise and ice mass as well. at least with satellite temps there are two distinct groups, with different affiliations, keeping an eye on each other. the other types of satellite measurements, not so much.