Satellite Records RSS-UAH now show 220 months of NO WARMING

Billy_Bob

Diamond Member
Sep 4, 2014
30,837
20,598
1,945
Top Of The Great Divide
Satellite Records RSS-UAH now show 220 months of NO WARMING

The days of being an outlier are over for satellite records. With corrections diurnal shift and orbital positions/distance the two different records are very much the same and both show a zero trend to slightly negative cooling for over 220 months.
figure-33.png


This will send the global alarmists screaming...

Source
 
With the new El Nino peak coming, Billy is going will have to change his kook tale from "No warming since 1998!" to "No warming since 2015!".

The good news for Billy is he'll probably be able to get 10 years of use out of his new lie.

Billy? Only the most flagrant cult liars cherrypick endpoints. That's you. And only the most flagrant cult liars discard the far more accurate surface data in favor of the much more twiddled, massaged, adjusted and fudged satellite data, which is understand by pretty much everyone to have a strong cooling bias.
Nice to see he nailed it. Something your models will never do. LOL you crack me up can you say....Losing
 
Nice to see he nailed it. Something your models will never do.
This is the text that goes with the graphs.
Version 6 of the UAH MSU/AMSU global satellite temperature dataset is ... revision of the procedures and computer code ... a new method for monthly gridpoint averaging; a new multi-channel method for computing the lower tropospheric (LT) temperature product; and a new empirical method for diurnal drift correction. … and other changes in processing procedures.
The bold faced phrases sure look like fiddling around with the data and models to me. That's no different than anyone else doing the same. That's not science, it's called cherry picking, and you think. "This will send the global alarmists screaming?" Not a chance.

 
I don't like responding to Mamooth's rants but....

How can he claim surface temperatures are more accurate now that they are all adjusted to expectations at the expense of individual station data?

The satellites actually sample most of the world's surface which is a hell of a lot better coverage than land stations. Satellites also dilute out UHI effects whereas surface stations smear it all over.

The one legitimate claim is that satellites and land stations measure different heights. Of course satellites also measure all the way up as well as near surface. I am certainly glad that there are two satellite teams that have a somewhat adversarial relationship rather than the surface station groups that play leapfrog to see who can adjust the data the most.

The satellite data is designed to measure the upper atmosphere where the CO2 would actually and possible cause temperature changes.

With much of the warming concentrated at the surface and the upper atmosphere not warming much at all. It actually debunks the whole AGW theory.

Dr Roy Spenser was very instrumental into getting this type of data from satellites.
 
I don't like responding to Mamooth's rants but....

How can he claim surface temperatures are more accurate now that they are all adjusted to expectations at the expense of individual station data?

The satellites actually sample most of the world's surface which is a hell of a lot better coverage than land stations. Satellites also dilute out UHI effects whereas surface stations smear it all over.

The one legitimate claim is that satellites and land stations measure different heights. Of course satellites also measure all the way up as well as near surface. I am certainly glad that there are two satellite teams that have a somewhat adversarial relationship rather than the surface station groups that play leapfrog to see who can adjust the data the most.

The Lower Troposphere (120 meters) is the surface temperature. That is what is making the alarmists so mad. I was just reading a few emails today about this newer version and how it corrected many deficiencies in the records interpretation. You must note that the recorded data did not change nor was it just thrown away like the CRU did, the data remains. It is how they handled the data that has changed.

In the lack of ground station areas they use stations on the fringes of the area, as in the arctic, and blanket the area with that temp. This is the primary reason for all rise in the last 60 years. it is an artifact of data point manipulation. The satellites have no such problem so it is very hard to create a false rise.

Others here say this new version looks like fiddling, but the reasons are clearly given for the changes and are openly discussed. The ground station changes are done in the dark of night and they refuse to give sound reasoning for their adjustments.

Then to match it up with the US-CRN stations areas and find almost a perfect match in the last 14 years. This is going to place the surface record adjustments further under the microscope. The fun is just beginning.
 
One of my colleagues just pointed out, in an email, that the Pargua surface adjustments can be checked with this new version to see if their break point evaluation and realignment by BEST was justified... I await his response to looking at specific sections of the satellite data compilation. This should be interesting.. It wont be pinpoint to station location but the general grid square should show if the adjustments were justified.

The fun has just begun..

Regardless of the temperature data, it still not prove that climate is being changed by human activities.
 
Satellite Records RSS-UAH now show 220 months of NO WARMING

The days of being an outlier are over for satellite records. With corrections diurnal shift and orbital positions/distance the two different records are very much the same and both show a zero trend to slightly negative cooling for over 220 months.
figure-33.png


This will send the global alarmists screaming...

Source
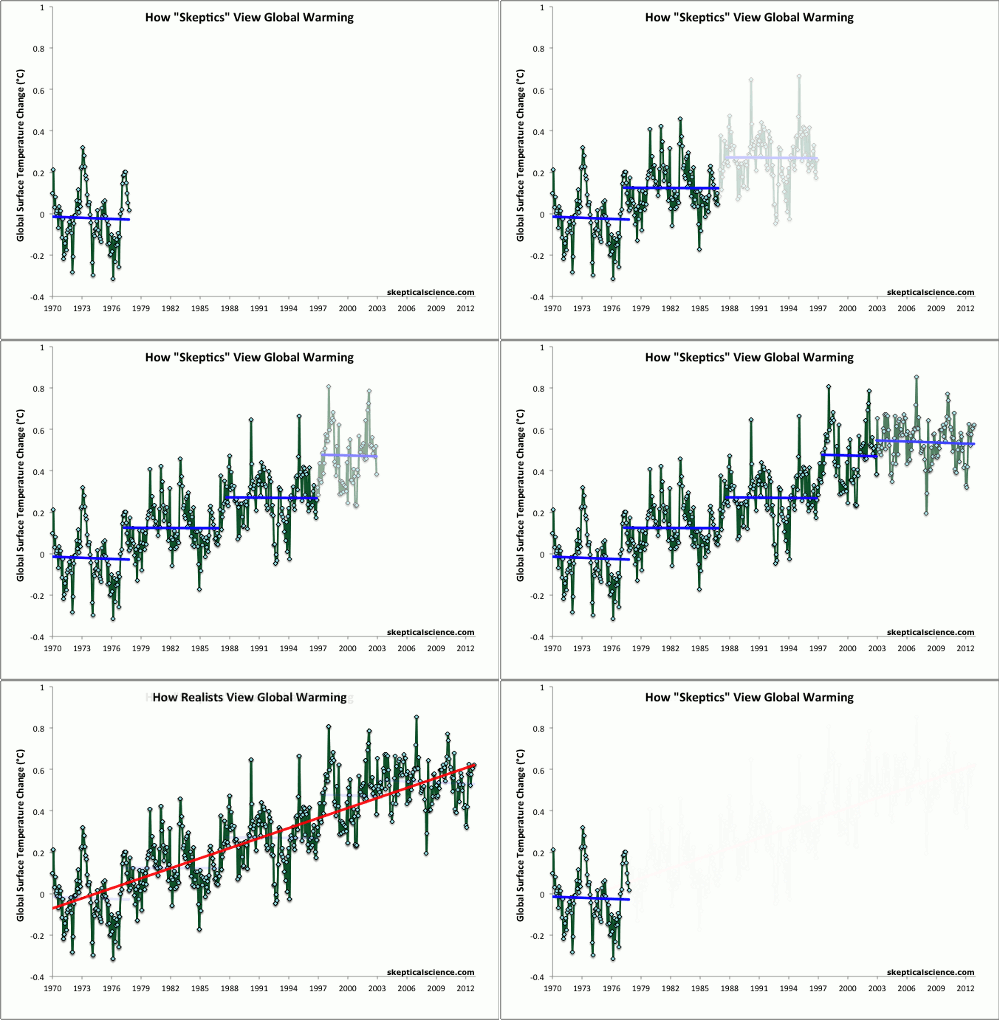
Escalator_2012_500.gif


Skeptics see both satellite products as producing trends since 1979 lower than station trends. Skeptics see station trends as much lower than climate model trends since 1979.

The doomsday scenarios being used to scare people into spending trillions of dollars simply aren't happening.
 
With the new El Nino peak coming, Billy is going will have to change his kook tale from "No warming since 1998!" to "No warming since 2015!".

The good news for Billy is he'll probably be able to get 10 years of use out of his new lie.

Billy? Only the most flagrant cult liars cherrypick endpoints. That's you. And only the most flagrant cult liars discard the far more accurate surface data in favor of the much more twiddled, massaged, adjusted and fudged satellite data, which is understand by pretty much everyone to have a strong cooling bias.

CO2 causes El Nino's?
 
Did the satellite include the warming that was eaten by the Pacific Ocean 700m+ deep? What about the Blob? Add in the Blob!
 
With the new El Nino peak coming, Billy is going will have to change his kook tale from "No warming since 1998!" to "No warming since 2015!".

The good news for Billy is he'll probably be able to get 10 years of use out of his new lie.

Billy? Only the most flagrant cult liars cherrypick endpoints. That's you. And only the most flagrant cult liars discard the far more accurate surface data in favor of the much more twiddled, massaged, adjusted and fudged satellite data, which is understand by pretty much everyone to have a strong cooling bias.

CO2 causes El Nino's?


Nope, it does not. It also does not control the PDO or AMO. It's funny how they couldn't 'find' any natural factors 20 years ago and insisted CO2 was the control knob for climate. Now that Mother Nature isn't cooperating they 'discovered' natural factors again.

Clearly, this so called unbiased satellite data is a DENIER! and must be corrected
 
Satellite data is a bitch to turn into meaningful measurements. I am happy that both camps are involved with the calculations. I wish the same situation was present in all the other altimetry fields like sea level rise and ice mass estimations. Unfortunately it costs a lot of money to have redundant groups working with the same raw data. UAH is only possible because they were grandfathered in at the start. I bet an independent group could get a much different view of SLR with only a few different assumptions or calibrations. I am not saying there is anything underhanded going on, just expectations having an impact on outcomes.
 
Now that Mother Nature isn't cooperating they 'discovered' natural factors again.
But wouldn't "natural factors" include cooling cycles? There has been no statistically significant cooling cycle in 100 years!
 
Now that Mother Nature isn't cooperating they 'discovered' natural factors again.
But wouldn't "natural factors" include cooling cycles? There has been no statistically significant cooling cycle in 100 years!


Most reconstructions have the LIA as the low point for this interglacial. I don't know why we came out of it and neither do you. For humanity's sake I hope we don't start dropping again. The Earth is warm and green right now. Enjoy it while it lasts.
 
It seems to me that satellite information would read the radiation at different levels of the atmosphere for different wave lengths because the outward radiation for each wavelength depends on what gas has a spectral absorption lines at that wavelength and what it's density is as a function of altitude. Between spectral absorption lines it would actually see the surface radiation.

I don't know what methodology UAH used, nor the resolution and bandwidth of the spectrometer, but in light of the above, it seems temperature might not be a very good measure of GW from a satellite. However, total radiant energy would be easier to measure. I would think that energy output would be more meaningful and accurate than a temperature calculation since the solar input energy can be directly related to the earth output energy.

The charts in the OP show temperature. At what altitude? I wonder if any satellite survey has actually measured total radiation output over an extended period.
 
Google is your friend. Use it.
Are you saying you don't know either if a survey of output radiation has been done? I will accept that. But the problem I have is in wading through the plethora of hits and finding the right key words that eliminate a lot of the google chaff. If you do know of any reference along that line I would appreciate it if you would let me know.
 

Forum List

Back
Top