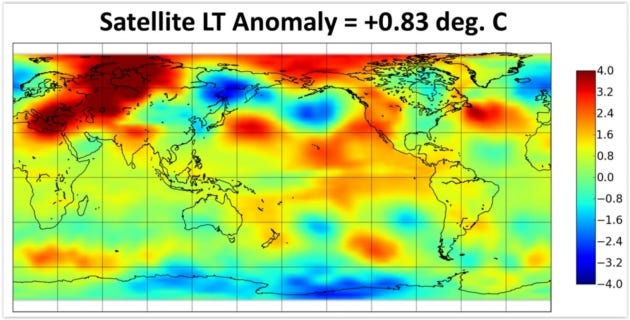
Meanwhile back in reality, NASA reports that this past February was the 2nd warmest on record
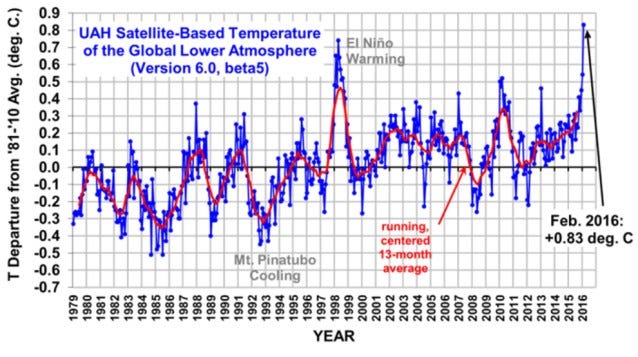
Agreement between the satellite and surface temperature data was good until about the year 2000, but since then NASA has been continuously tampering with their data to create the impression of non-existent warming. Just during the month after the election NASA altered their data even further.
Read more:
No Global Warming For 25 Years | The Deplorable Climate Science Blog
And another crackpot conspiracy theory wacko pops up with more deranged drivel and bogus pseudo-science from yet another demented denier cult blog. All of which is based on the laughably insane notion that tens of thousands of scientists working in all the many fields associated with climate studies, in dozens of countries all around the world, ARE ALL IN A GIANT CONSPIRACY, for unknown reasons, to all get the same kind of data in their research as all the others and reach the same logical conclusions.
You seem too stupid to grasp how ridiculous your idiotic distrust and denial of science really is, Murky.
s0n......not sure you are aware but the presentation you make reeks of somebody who's head is exploding because their argument is being made to look laughable by the other guys!! Trust me......you'll have far more credibility without the mental meltdowns.....that's just the way it is. More than half the country thinks the whole CO2 narrative is bogus........you guys gotta find a way to deal with that. Or......you can ignore it and continue to look like incoherent k00ks that are losing!