
ScienceRocks
Democrat all the way!
- Banned
- #1
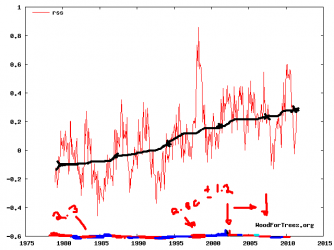
I made a temperature trend with enso overlayed.
Blue=La nina
Red=Nino
1998 was a huge anomaly, while 1992-1994 was another caused by a massive volcano eruption. 2002-2007 was pretty stable within the enso with nothing going over weak moderate on either side. So it was close to the "baseline".
Nino's 1982-1984, 1986-1987, 1991-1993, 1997-1998, 2003, late 2004 to early 2005, 2006-2007, 2010.
Nina's 1985, 1988-1990, 1995-1996, 1999-2001, 2003-2004 weak one, late 2005, late 2007-2008, most of 2010 through 2011.
1980 we were near -.1c on avg, but today were near .3c or .4c of warming has occurred within the past 30 years. So we're nearly 90 years from 2100. This means that if the current trend keeps up we could get 1.2c of warming. So today's avg of .4c will be 1.6c and any record holded today will be utterly destroyed.
Attachments
Last edited: